Problem statement : Selecting the pie chart visualization. Then, at the value options drop-down, I select “Count” as Calculation function and “family” as selected field (Family represents the type of robot).
Step to solve pie chart is not showed and the legend only shows “family” instead of the different types of families.
Step 1: Create table and insert data using these query.

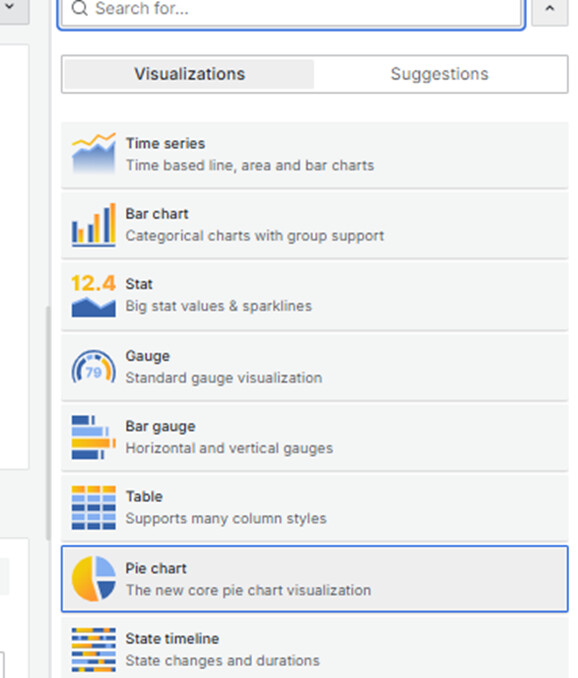
Step 2: Select Pie chart and then Fetch the data using grafana query.
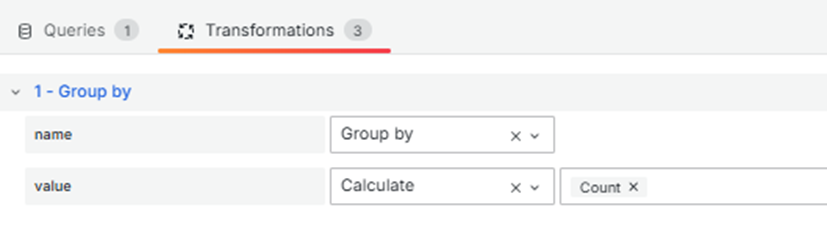
Step 3: Now apply transformations
• Group by transformation then select name: Group by , value: Calculate → Count
• Transpose transformation

• Organize fields by name and hide the Field

Step 4 : Now, select the fields you want to display on the chart (in my case, all fields data will be shown).

Final output: Data show according to fields select in dropdown.

Problem statement: I’m selecting the pie chart visualization. Then, at the value options drop-down, I select “Count” as Calculation function and “family” as selected field (Family represents the type of robot)
Suggestion : In the pie chart visualization, you are currently trying to display the data row-wise. However, it would be more effective to use a column-wise approach and then visualize the data on the pie chart.