-
What Grafana version and what operating system are you using?
v9.2.2 Windows 11
-
What are you trying to achieve?
Set a threshold as a percentage of one query result out from the result of another query.
-
How are you trying to achieve it?
-
What happened?
-
What did you expect to happen?
-
Can you copy/paste the configuration(s) that you are having problems with?
-
Did you receive any errors in the Grafana UI or in related logs? If so, please tell us exactly what they were.
-
Did you follow any online instructions? If so, what is the URL?
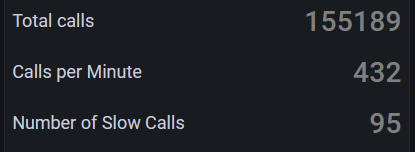
For example, I’d like to have Number of Slow Calls display in red if its value exceeds from 10% de number of total calls.
What is your data source?
I would do it with Overrides value mapping
Infinity. As a first step, I’d need to set the thresholds as percentages of other values. Then, I need to retrieve via HTTP request a value to set as threshold. Are these things possible?
use jsonata or transformations to get the percentages.
I am not a fan of transformation, I like to do it on the data source itself.
But… how does this relate to thresholds? I mean… how to utilize the calculated values as thresholds?
this is what you want, coloring something. threshold is not the only way to color things. You can also color things using overrides. In the below case notice the value mapping of a range between 10 and 100
I’m afraid this is different. It’s not the percentage I want to be colored, but a stat when it exceeds a given percentage.
the same principle applies. is it a calculated value or static value? Please provide sample json data coming from your api
Given a JSON like this, I’d like Grafana to color it in red, for example, when current is higher than 10% of the result of another query in the same panel.
[
   {
      "metricId":5191222,
      "metricName":"aaa",
      "metricPath":"aaa",
      "frequency":"CUSTOM",
      "metricValues":[
         {
            "startTimeInMillis":1704312420000,
            "occurrences":23,
            "current":2886,
            "min":0,
            "max":120545,
            "useRange":true,
            "count":858702,
            "sum":216513341,
            "value":252,
            "standardDeviation":0
         }
      ]
   }
]
is the other query also using infinity? My telepathic powers are at zero today so cant read your pc remotely 
Yes… All of the queries in this dashboard are using infinity. Thank you for your interest!
I’d also like to compare queries’ results from different panels, so that I can paint in red, for example, the worse.
May be ‘Config from query results’ transformation would help in your case:
https://play.grafana.org/d/Fc6gwV4nz/transforms-config-from-query?orgId=1&viewPanel=6
Add additional field to your query that would contain required value color basing on calculated in the same query dynamic threshold.
1 Like
but be attentive with “config from query result”.
The same value has always the same colour.
look at the “OK”…


