How to aggregate multiple CloudWatch metrics into a single total for success rate calculation?

Hello,

I am looking for advice on how to agregate multiple numeric values into a single value from a list of dimension values.

  • What Grafana version and what operating system are you using?

Amazon Managed Grafana 10.4.1 using the cloudwatch data source

  • What are you trying to achieve?

We are creating success rate panels using Stats.

Example will use Lambda, but same issue with API Gateway and other queries with multiple dimensions like this.

  • How are you trying to achieve it?

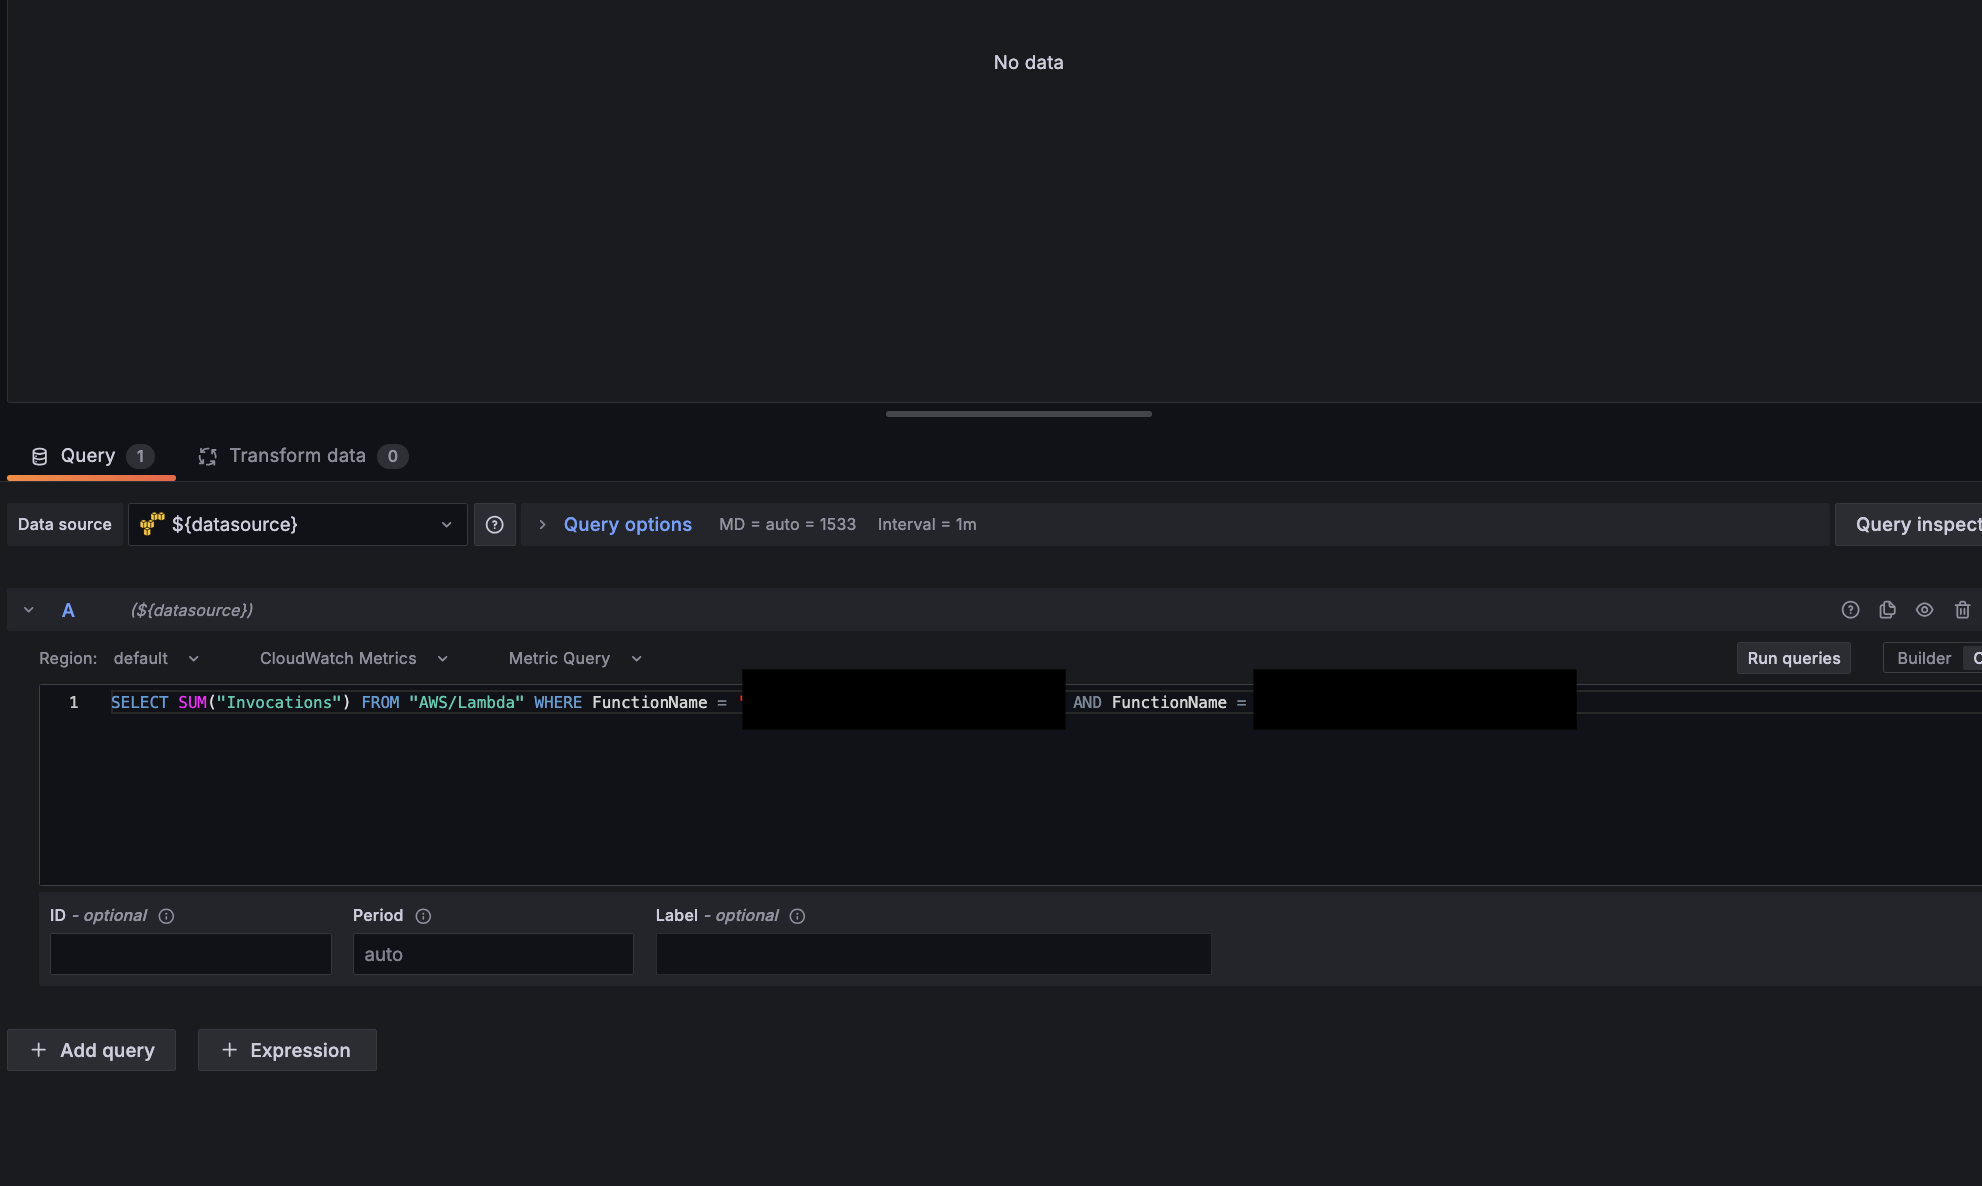
Starting with a query variable $function. This is a list of all FunctionNames to include.

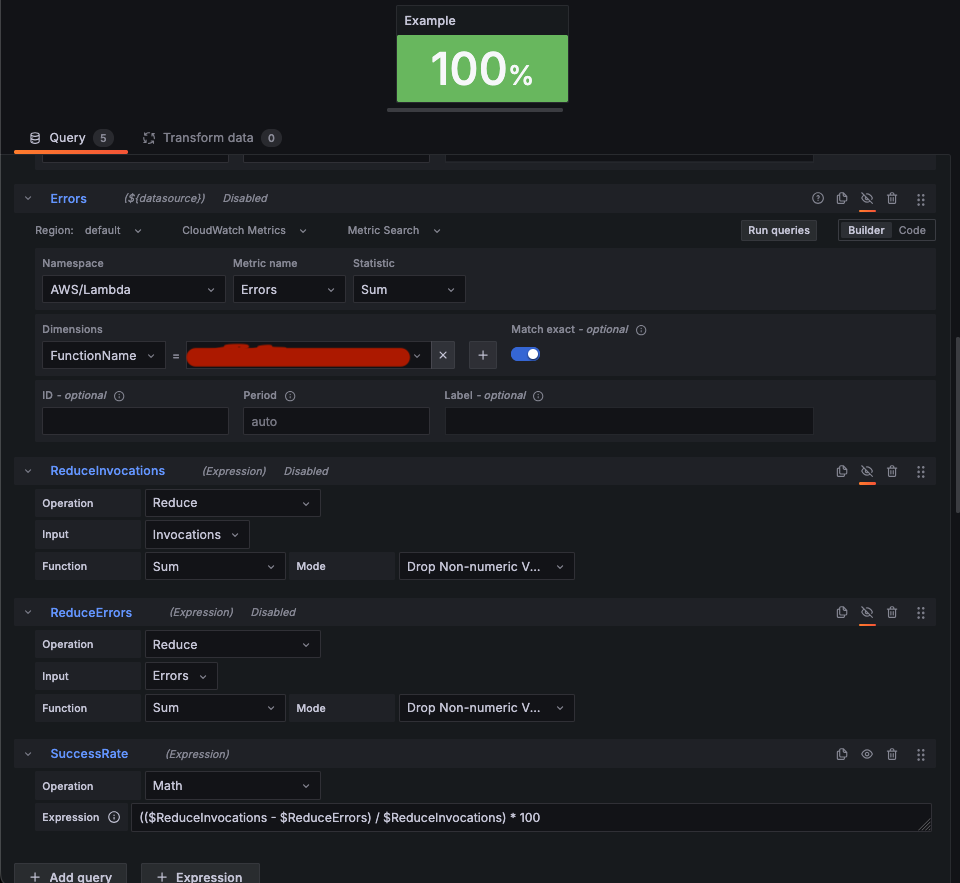
In a visualisation, there are 2 Cloudwatch metrics queries, one for Invocations and another for Errors, each grouped by FunctionName.

Passing in $function as the dimension value for FunctionName successfully retrieves the time series data for Invocations/Errors of the listed functions.

Each query is passed to a Reduce expression and that reduce is then used in a math expression.

  • What happened?

For queries where there’s no dimension passed, or where there is a single dimension passed, this works.

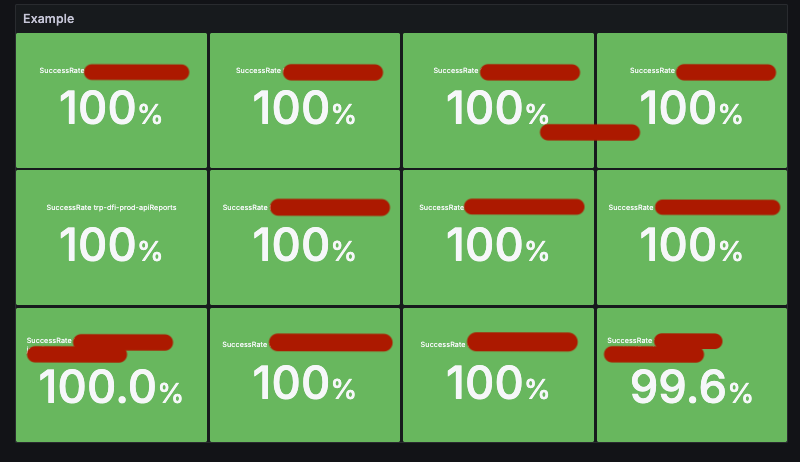
For multiple functions, the sums are still grouped by FunctionName.

  • What did you expect to happen?

For this panel, we need to have a Total of all the Invocations/Erros combined to be used in the calculation.

  • Can you copy/paste the configuration(s) that you are having problems with?

Example Panel JSON:

{
  "datasource": {
    "uid": "${datasource}",
    "type": "cloudwatch"
  },
  "fieldConfig": {
    "defaults": {
      "mappings": [],
      "thresholds": {
        "mode": "absolute",
        "steps": [
          {
            "color": "#3274D9",
            "value": null
          },
          {
            "color": "dark-red",
            "value": 85
          },
          {
            "color": "#EAB839",
            "value": 99.5
          },
          {
            "color": "dark-green",
            "value": 100
          }
        ]
      },
      "unit": "percent"
    },
    "overrides": []
  },
  "gridPos": {
    "h": 15,
    "w": 15,
    "x": 0,
    "y": 12
  },
  "id": 4,
  "options": {
    "reduceOptions": {
      "values": false,
      "calcs": [],
      "fields": ""
    },
    "orientation": "auto",
    "textMode": "auto",
    "wideLayout": true,
    "colorMode": "background_solid",
    "graphMode": "area",
    "justifyMode": "center",
    "showPercentChange": true
  },
  "pluginVersion": "10.4.1",
  "title": "Lambda example",
  "type": "stat",
  "targets": [
    {
      "datasource": {
        "type": "cloudwatch",
        "uid": "..."
      },
      "id": "",
      "region": "default",
      "logGroups": [],
      "queryMode": "Metrics",
      "namespace": "AWS/Lambda",
      "metricName": "Invocations",
      "expression": "",
      "dimensions": {
        "FunctionName": "$function"
      },
      "statistic": "Sum",
      "period": "",
      "metricQueryType": 0,
      "metricEditorMode": 0,
      "sqlExpression": "",
      "matchExact": true,
      "stat": "Sum",
      "refId": "Invocations",
      "label": "",
      "hide": true
    },
    {
      "datasource": {
        "type": "cloudwatch",
        "uid": "..."
      },
      "id": "",
      "region": "default",
      "logGroups": [],
      "queryMode": "Metrics",
      "namespace": "AWS/Lambda",
      "metricName": "Errors",
      "expression": "",
      "dimensions": {
        "FunctionName": "$function"
      },
      "statistic": "Sum",
      "period": "",
      "metricQueryType": 0,
      "metricEditorMode": 0,
      "sqlExpression": "",
      "matchExact": true,
      "stat": "Sum",
      "refId": "Errors",
      "label": "",
      "hide": true
    },
    {
      "datasource": {
        "type": "__expr__",
        "uid": "__expr__",
        "name": "Expression"
      },
      "refId": "ReducedInvocations",
      "type": "reduce",
      "hide": true,
      "reducer": "sum",
      "expression": "Invocations",
      "settings": {
        "mode": "replaceNN",
        "replaceWithValue": 0
      }
    },
    {
      "datasource": {
        "type": "__expr__",
        "uid": "__expr__",
        "name": "Expression"
      },
      "refId": "ReducedErrors",
      "type": "reduce",
      "hide": true,
      "reducer": "sum",
      "expression": "Errors",
      "settings": {
        "mode": "replaceNN",
        "replaceWithValue": 0
      }
    },
    {
      "refId": "SuccessRate",
      "type": "math",
      "hide": false,
      "expression": " ((${ReducedInvocations} - ${ReducedErrors}) / (${ReducedInvocations})) * 100"
    }
  ],
  "transformations": [
    {
      "id": "renameByRegex",
      "options": {
        "regex": "SuccessRate.*",
        "renamePattern": "SuccessRate"
      }
    }
  ]
}


  • Did you receive any errors in the Grafana UI or in related logs? If so, please tell us exactly what they were.

No errors.

  • Did you follow any online instructions? If so, what is the URL?

I have searched the forum for similar issues and found this: Summing all fields matching certain pattern - #2 by usman.ahmad

The Rename by regex transformation successfully renames from FunctionName to SuccessRate, but then reducing with Add field from calculation does not produce a sum total of all the functions.

Please let me know if there’s any more info needed.
Thanks,

What visualization do you want to use at the end to show this value?

Can you please share the table view of your data if possible ?

Hi @yosiasz,

Thanks for responding.

The aim is to display a single percentage based on a math calculation. Very simple when working with a small number of functions. The example in the image shows two queries with a single function name hard coded, Invocations and Errorrs, two reduce expressions, and then a math expression to create the percentage.

This is the target JSON to query a single with a single function in the FunctionName dimension

    {
      "id": "",
      "region": "default",
      "logGroups": [],
      "queryMode": "Metrics",
      "namespace": "AWS/Lambda",
      "metricName": "Invocations",
      "expression": "",
      "dimensions": {
        "FunctionName": "functionName"
      },
      "statistic": "Sum",
      "period": "",
      "metricQueryType": 0,
      "metricEditorMode": 0,
      "sqlExpression": "",
      "matchExact": true,
      "datasource": {
        "uid": "${datasource}",
        "type": "cloudwatch"
      },
      "refId": "A",
      "hide": false,
      "label": ""
    }

Data table view would be as such:

Time Invocations
2025-11-06 14:12:00 6
2025-11-06 08:40:00 9
2025-11-06 08:23:00 3

Errors works the same.

In our case, we pass a list of functions from a query variable as $functions

    {
      "id": "",
      "region": "default",
      "logGroups": [],
      "queryMode": "Metrics",
      "namespace": "AWS/Lambda",
      "metricName": "Invocations",
      "expression": "",
      "dimensions": {
        "FunctionName": "$functions"
      },
      "statistic": "Sum",
      "period": "",
      "metricQueryType": 0,
      "metricEditorMode": 0,
      "sqlExpression": "",
      "matchExact": true,
      "datasource": {
        "uid": "${datasource}",
        "type": "cloudwatch"
      },
      "refId": "A",
      "hide": false,
      "label": ""
    }

Data table view now shows a drop down with each FunctionName and the data looks like this:

Time FunctionName
2025-11-06 14:12:00 6
2025-11-06 08:40:00 9
2025-11-06 08:23:00 3

This creates multple values in the panel, which is not desired.

What we are trying to do is sum the data from each function into a single value before the math expression - e.g. AllInvocations and AllError.

You can use CloudWatch math:

Hi @jangaraj,

Thanks for responding.

I think the thread you have linked does not fully answer my question.

The example panel takes a variable that is a single load balancer name, not a list.
Using a list of load balancer names would cause the IF function in that example to error because of the multiple dimensions.

With a single value:

With a list:

Whether it’s Grafana or CloudWatch math is not particularlly important. But having multiple dimensions in the query is still the issue. Do you know a way to aggregate the dimension values using cloudwatch math?

I don’t think you can have a list here:

It can be single value, or ‘*’. IMHO that is CloudWatch API limitation, not Grafana limitation.
Can you use list in the filter in the AWS CloudWatch console?

Actually, it can be a list. I also didn’t think this would work, as you are right that this kind of thing is not possible in CW console. But here’s a screenshot with table view as proof:

1 Like

You have error in expression - you need to play more with that - maybe that’s too much for this query language.

You may try SQL like CloudWatch query language -

I would say first create query in AWS console and then you can replicate that in Grafana.

Another option, IMHO the most promising is to use Grafana SQL expression.

1 Like

I also was going to definitely recommend sql expression to tie it all up

That error in the CW math is not relevant. It’s because the type is a TS not a TS. I made that panel based on your example to demonstrate that the issue with multiple dimensions remains. As SUM does not aggregate dimension values, I do not think CloudWatch math will work.

Unfortunately, there are too many issues with using SQL Cloudwatch in Grafana at present. For one, you can only run a single query in a panel. Additionally, OR is not valid keyword, only AND.

Valid (but no data obv)

Invalid

So this cannot be used on multiple FunctionNames.

Builder mode for Metrics Query does not quote the metric names, causing errors where Count is both a metric and a reserved keyword, for example. But I digress…

Given that I have successfuly retreived the data I need using the Metrics Search in Builder mode, all I need is a way to aggregate the dimensions.

Surely, this must be possible?

Sql expression was recommended, try that

Hi @yosiasz

Please see the reply I made to @jangaraj. I have used SQL as you can see in the screenshots.

Without OR how can I query for multiple lambda functions?

This still doesn’t answer the fundamental issue either. How do I aggregate the dimensions in a SQL statement?

That’s “CloudWatch SQL”. But recommendation is to use “Grafana SQL”.

So you have your CloudWatch query with that terrible format. Grafana will convert CloudWatch query results into temp SQL tables and you can apply mature SQL query langues on the top. I’m linking already linked doc:

1 Like

This is a preview feature and cannot be enabled in managed grafana.

Back to square one :disappointed_face:

2 Likes

It’s AMP, so AWS is supporting that = you can ask your AWS support in this case.