I just tried to install Grafana & OpenTSDB
I setup a dashboard to show average value of temperature but I’m not sure how Grafana calculates
The average is calculated from all data in database or it’s calculated from the timeframe which I selected?
Can you please advise
Thank you so much
Grafana only calculates averages and such based on the data returned from a datasource so only from the selected time range. Usually time series databases that Grafana integrates against have this functionality builtin.
Marcus
1 Like
Hi!
I’ve raised a ticket in Git because I really cannot understand how average is working. The ticket was closed, but I still have some questions: How Grafana calculates average? · Issue #20784 · grafana/grafana · GitHub
The things is that Grafana’s member told me that average depends on the query and data source, and Grafana only calculates average on Graphs and singlestat, however I have still some doubts. The average is different when I zoom in to 1m than when I zoom out to 2m:
1m interval
2m interval

Could you please help? Thanks!
How many data samples are there on the second one?
Hi clanlaw,
Just one, so, of course the average matches to that point. However, I don’t how that number (7226) is calculated. It should be the average between the above numbers, but it’s not. I’m using Elastic.
Regards
1 Like
I don’t understand what you mean. What value is the original data point for which it is calculating the average?
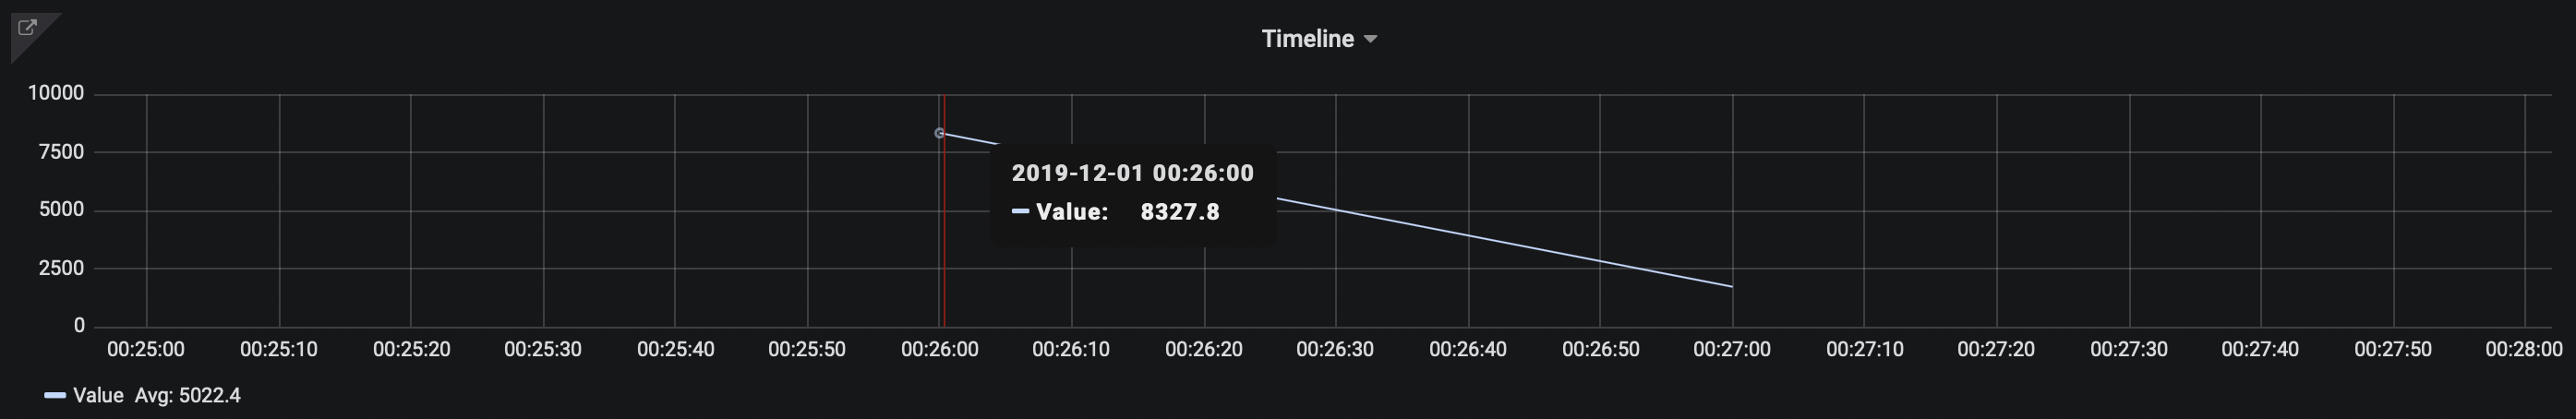
When I zoom in to 1m, there are two values:
2019-12-01T00:26:00+01:00 8327,8
2019-12-01T00:27:00+01:00 1717
However, when I zoom out to 2m, I get just one, 7226, but it should be the average: 5022.
Regards
What is the query you are using?

If you look in the query inspector does it agree with the chart?
1 Like
