How does the time ranges work?

Hello all,

I’m currently setting up a few dashboards… the thing which confuses me the most is the time range setting.

For example:
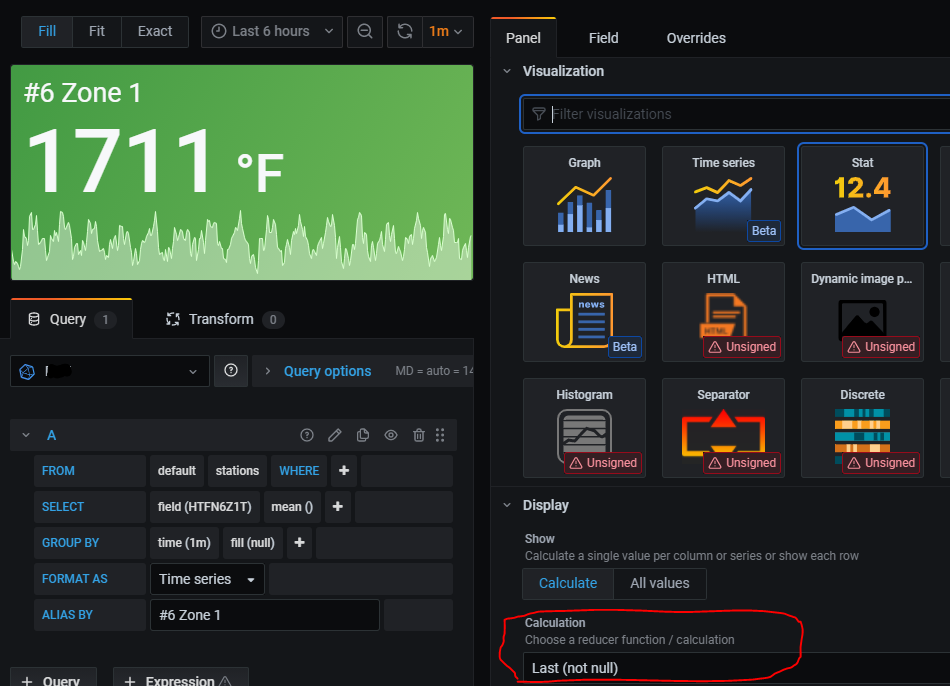
I use a stats panel which receives one value. The current value is 0, 20 minutes ago it was 1 for a few minutes.
Why is the stats panel showing 1 instead of 0 if I select a time range of 6 hours? Shouldn’t display the panel the current live value of 0?

If I set the time range to now-now it shows the right live value but the then there is no graph.

I haven’t found a good explanation of how the time series setting is working…

Regards
SchiSchi

Use the Query Inspector to see:

a) exactly what query is being run against your back-end data store, and

b) what results come back for Grafana to display.

This should give you some insight into what’s going on, if not then paste that
information here (pasting text is better than screenshots, especially for
email users) and someone might be able to help work out what’s happening.

Antony.

So that means this isn’t standard behavior? :smiley:

I didn’t say that…

I said that the Query Inspector will show what is happening.

It might be perfectly expected behaviour, or it might be a bug, or it might be
something you don’t realise about the data being returned by the query.

I was simply advising how to get more information about what is happening.
Then comes the question of why it’s happening and how to change it if you
want something else to happen :slight_smile:

Antony.

Ok, thanks!

So this is what I get if I set 5 minutes as time range:

{
“request”: {
“data”: “request={"specification":["template",{"site":null,"host_name":"HOST_ANONYMIZED","service_description":"SERVICE_ANONYMIZED","graph_index":1}],"data_range":{"time_range":[1614957002,1614957242]}}”,
“url”: “DATASOURCE_ANONYMIZED_check_mk/webapi.py?_username=automation&_secret=SECRET_ANONYMIZED&output_format=json&action=get_graph”,
“method”: “POST”,
“hideFromInspector”: false
},
“response”: {
“result”: {
“step”: 60,
“start_time”: 1614957000,
“end_time”: 1614957300,
“curves”: [
{
“color”: “#cc00ff”,
“title”: “Files”,
“line_type”: “area”,
“rrddata”: [
0,
0,
0,
0,
null
]
}
]
},
“result_code”: 0
}
}

This if I use 6 hours:

{
“request”: {
“data”: “request={"specification":["template",{"site":null,"host_name":"HOST_ANONYMIZED","service_description":"SERVICE_ANONYMIZED","graph_index":1}],"data_range":{"time_range":[1614935893,1614957433]}}”,
“url”: “DATASOURCE_ANONYMIZED_check_mk/webapi.py?_username=automation&_secret=SECRET_ANONYMIZED&output_format=json&action=get_graph”,
“method”: “POST”,
“hideFromInspector”: false
},
“response”: {
“result”: {
“step”: 60,
“start_time”: 1614935880,
“end_time”: 1614957480,
“curves”: [
{
“color”: “#cc00ff”,
“title”: “Files”,
“line_type”: “area”,
“rrddata”: [
0,
0,
0,
0,
0,
0,
0,
0,
0,
0,
0,
0,
0,
0,
0,
0,
0,
0,
0,
0,
0,
0,
0,
0,
0,
0,
0,
0,
0,
0,
0,
0,
0,
0,
0,
0,
0,
0,
0,
0,
0,
0,
0,
0,
0,
0,
0,
0,
0,
0,
0,
0,
0,
0,
0,
0,
0,
0,
0,
0,
0,
0,
0,
0,
0,
0,
0,
0,
0,
0,
0,
0,
0,
0,
0,
0,
0,
0,
0,
0,
0,
0,
0,
0,
0,
0,
0,
0,
0,
0,
0,
0,
0,
0,
0,
0,
0,
0,
0,
0,
0,
0,
0,
0,
0,
0,
0,
0,
0,
0,
0,
0,
0,
0,
0,
0,
0,
0,
0,
0,
0,
0,
1.06667,
2,
2,
2,
2,
2,
2,
2,
2,
2,
2,
2,
2,
2,
2,
2,
2,
2,
2,
2,
2,
2,
2,
2,
2,
2,
2,
2,
2,
2,
2,
2,
2,
2,
2,
2,
2,
2,
2,
2,
2,
2,
2,
2,
2,
2,
2,
2,
2,
2,
2,
2,
2,
2,
2,
2,
2,
2,
2,
2,
2,
2,
2,
2,
2,
2,
2,
2,
2,
2,
2,
2,
2,
2,
2,
2,
2,
2,
1.1,
0,
0,
0,
0,
0,
0,
0,
0,
0,
0,
0,
0,
0,
0,
0,
0,
0,
0,
0,
0,
0,
0,
0,
0,
0,
0,
0,
0,
0,
0,
0,
0,
0,
0,
0,
0,
0,
0,
0,
0,
0,
0,
0,
0,
0,
0,
0,
0,
0,
0,
0,
0,
0,
0,
0,
0,
0,
0,
0,
0,
0,
0,
0,
0,
0,
0,
0,
0,
0,
0,
0,
0,
0,
0,
0,
0,
0,
0,
0,
0,
0,
0,
0,
0,
0,
0,
0,
0,
0,
0,
0,
0,
0,
0,
0,
0,
0,
0,
0,
0,
0,
0,
0,
0,
0,
0,
0,
0,
0,
0,
0,
0,
0,
0,
0,
0,
0,
0,
0,
0,
0,
0,
0,
0,
0,
0,
0,
0,
0,
0,
0,
0,
0,
0,
0,
0,
0,
0,
0,
0,
0,
0,
0,
0,
0,
0,
0,
0,
0,
0,
0,
0,
0,
0,
0,
0,
0,
0,
null
]
}
]
},
“result_code”: 0
}
}

I think your query may be fine. For a Stat panel to display the most recent value, I select the calculation as “Last (not null”) per the red circled area shown here:

Yes, I selected the same… thats the point which I’m just not understand.

Please provide the text of your query (not the output of the query). Also specify what datasource you are using and which version of Grafana. Thank you.

This topic was automatically closed after 365 days. New replies are no longer allowed.