Hi!
I have googled for hours and pursued different solutions but always ended up at a dead end. Help!
I am using Hass.io (0.101.3) on a Raspberry 3b+ with the add-ons Grafana (3.0.0) and InfluxdB (3.3.0). Data flows fine from Hass.io to InfluxdB and is visualized in Grafana.
I then want to get the Grafana panels into Hass.io and are using iframe…
’’’
cards:
type: iframe
id: graf1
url: http://192.168.1.65:8123/api/hassio_ingress/8R0NvNvb6b-5pPEF3Z7zvNDIusRAuQtFDEK4pGd-FHQ/d-solo/OMoaJ1mRk/grafana?orgId=1&theme=light&panelId=4
type: iframe
id: graf2
url: http://192.168.1.65:8123/api/hassio_ingress/8R0NvNvb6b-5pPEF3Z7zvNDIusRAuQtFDEK4pGd-FHQ/d-solo/OMoaJ1mRk/grafana?orgId=1&theme=light&panelId=2
’’’
…and it works just fine on my desktop computer (windows, chrome) both with local IP and diskstation. me to the raspberry.
But when I try to connect through my phone (iPhone) by either using Chrome or the Home Assistant Companion Beta app the panels are replaced by “401: Unauthorized” if connected to the local LAN and blank panels if on the mobile network. What am I doing wrong?
I have found this lead in the Grafana documentation “this sharing require either anonymous access or setting [cookie_samesite] to none” but aren’t successful in using it.
’’’
my Grafana Config
{
“plugins”: ,
“env_vars”: ,
“log_level”: “info”,
“ssl”: false,
“certfile”: “fullchain.pem”,
“keyfile”: “privkey.pem”
}
’’’
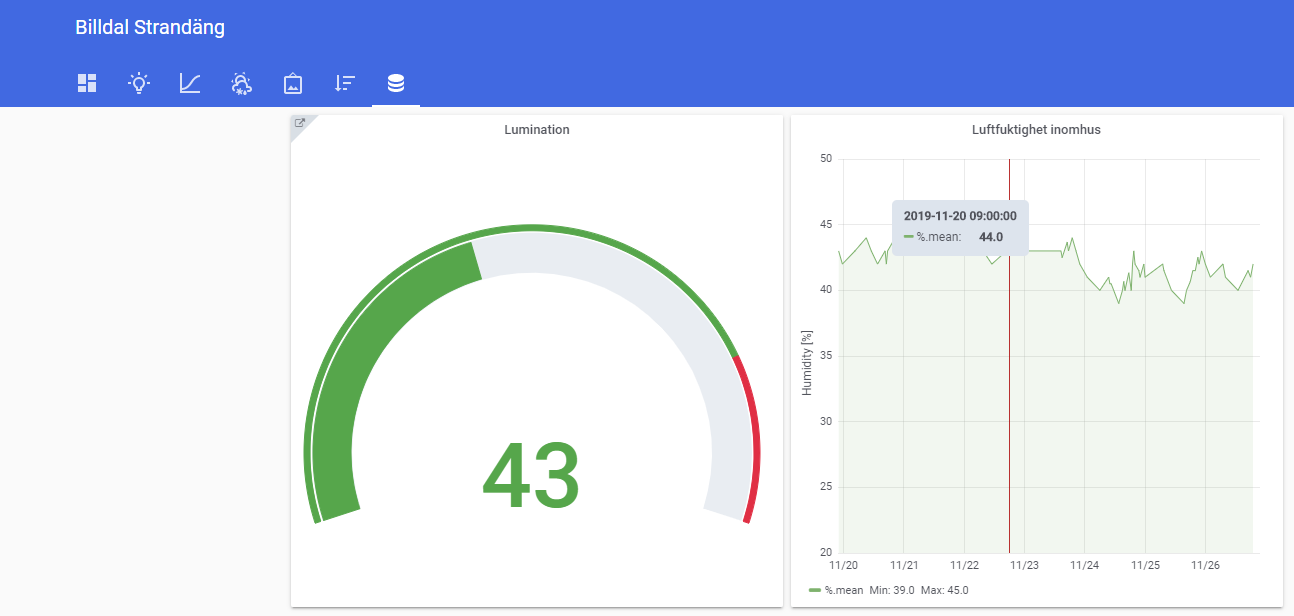
Some images of what I see.