- What Grafana version and what operating system are you using?
docker image - 8.1.1
- What are you trying to achieve?
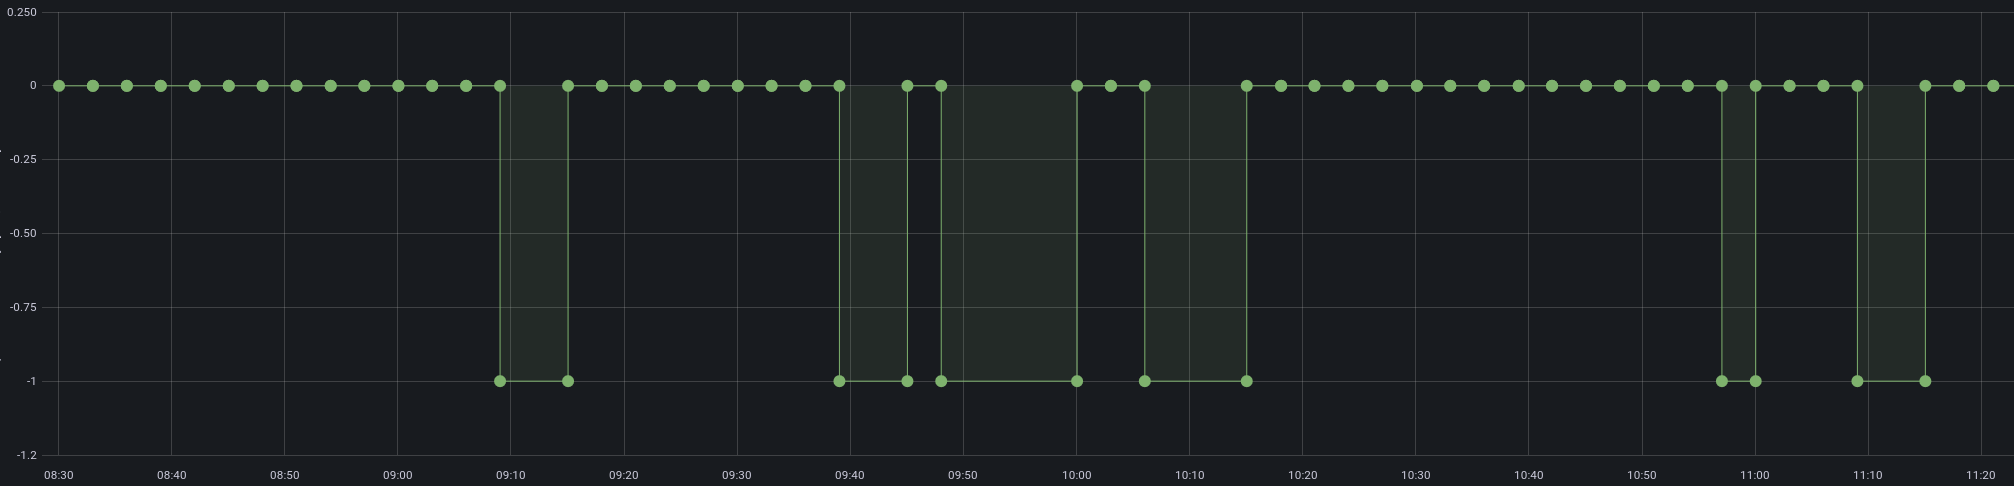
rendering graph below takes about 60s to load → i want it to load much much faster
- How are you trying to achieve it?
i am using postgres as datasource, i am selecting the data with following query:
SELECT
    created as time,
    case when action = 'INCREASE_POWER' then 1
         when action = 'NORMAL_POWER' then 0
         when action = 'DECREASE_POWER' then -1
    end
FROM ${schema}.control_action
WHERE
  $__timeFilter(created)
ORDER BY 1;
- What happened?
query is not so slow, it takes about ~70ms (i checked it with pgadmin and i checked it also with devtools during dashboard load, similar numbers) - it returns only 120 records, but grafana renders the graph in 1 minute - no errors, no warnings, no hanging request
any ideas how to fix this?