Hello
I have a simple Grafana Dashboard with a bunch of time series graphs. The graphs have one InfluxDB Data source configured. I have configured this Dashboard as Public dashboard.
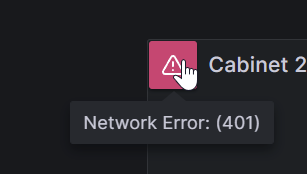
When opening the resulting link in a Private Browser Window I get red marks as it can’t load the data:

When opening the same public dashboard in the normal Browser Window it works. The difference is that I’m authenticated in the normal Browser Window.
The interesting part is that this issue is present on grafana/grafana-oss:10.2.1, but it works again if I downgrade to grafana/grafana-oss:10.1.5.
Do I need to configure my InfluxDB data source differently or is this a Grafana Bug?
This is the failing HTTP Request: