Hi I am using Grafana 4.1.2 , on Ubuntu 16.04 xenial. I am publishing Snap-Telemetry data using snap-publisher for influxdb from a system on the private network to my controller system, I can see that the data is available in the influxdb, but Grafan fails to display the same. Same thing I have done locally on the controller with a different snap-plugin called process and published the data using same influxdb publisher and Grafana displays the data.
I checked the /var/log/grafana/grafana.log and its out put is.
t=2017-07-12T10:02:16+0530 lvl=info msg=“Request Completed” logger=context userId=1 orgId=1 uname=admin method=GET path=/query status=502 remote_addr=127.0.0.1 time_ms=0s size=0
and
t=2017-07-13T11:32:34+0530 lvl=eror msg=“Unable to load datasource meta data” logger=context userId=1 orgId=1 uname=admin error="Data source not found"
t=2017-07-13T11:32:34+0530 lvl=eror msg=“Request Completed” logger=context userId=1 orgId=1 uname=admin method=GET path=/api/datasources/proxy/23/query status=500 remote_addr=127.0.0.1 time_ms=0s size=49
t=2017-07-13T11:32:46+0530 lvl=eror msg=“Unable to load datasource meta data” logger=context userId=1 orgId=1 uname=admin error="Data source not found"
t=2017-07-13T11:32:46+0530 lvl=eror msg=“Request Completed” logger=context userId=1 orgId=1 uname=admin method=GET path=/api/datasources/proxy/23/query status=500 remote_addr=127.0.0.1 time_ms=0s size=49
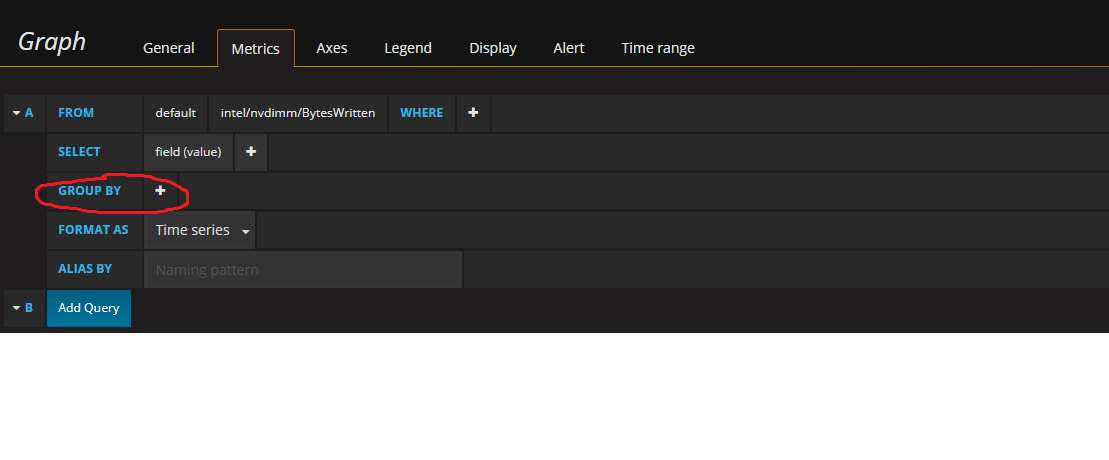
This issue got fixed, the issue was with Group By option, unchecked it and data got displayed, good learning, not much support on the net, hope this might help some one facing similar issue… I was digging my Snap-plugin code which had no issue
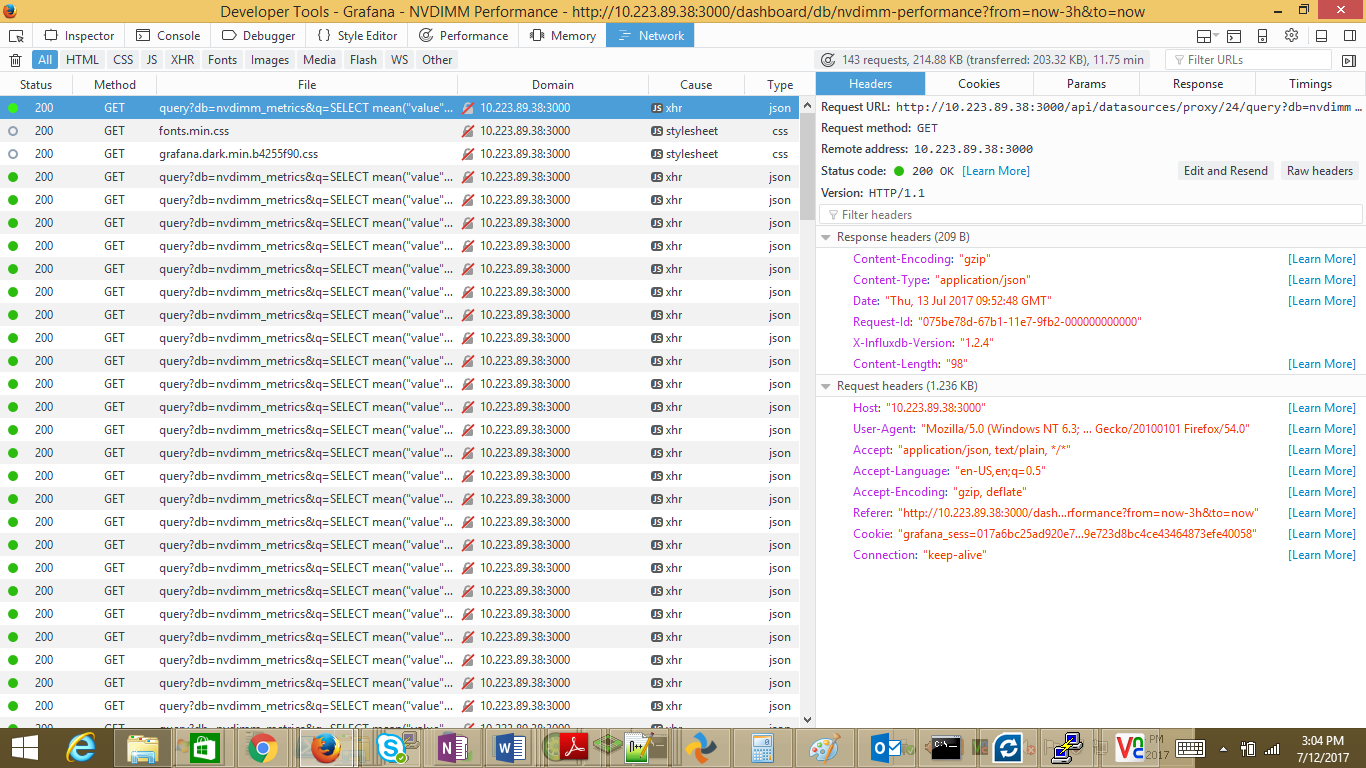
Can you show the query with the Group By and the raw query that is sent to InfluxDB. You can get the raw query by looking at the request headers in the network tab in Chrome Dev Tools.