I have an embedded computer with Grafana (9.3.6 and MQTT broker (mosquitto) running in docker containers and using docker network they can connect to each other and outside world. I have another IoT device that publishes data to the broker, and I can subscribe to the topic from my computer using MQTTX and Python, and I can also publish so that all devices thus far get the info.
In the Grafana GUI I installed the MQTT plugin, and entered the broker info, and successfully connected to it, but using explore and dashboard time series widget I cannot get data from the broker to Grafana.
How do I actually subscribe to a datasource so that I can get data streaming to the dashboard with MQTT plugin?
I’ve had the same struggle.
First check the uri string. It should start with ‘tcp’ and not with ‘mqtt’.
Second check your topic description. Don’t use spaces in your topic and don’t put your topic between " or '. Your topic should look like domoticaserver/co2-sensor/co2
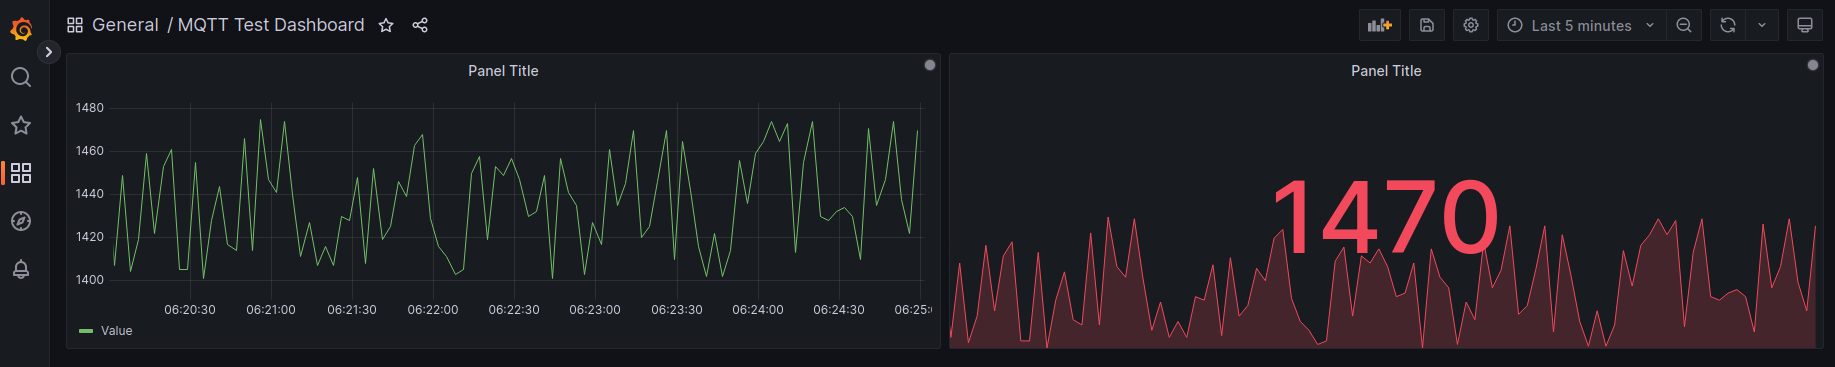
I’m seeing data coming in, however it is far from stable. It looks like frequent redraw of the canvas and graphs/gauges stop working from time to time.
Not working. I set up mosquitto with both websockets on one port, and mqtt on another port, Grafana MQTT configuration page says to both “connected”, but data doens’t come through. I have another window open with MQTTX subscribed to the same topic, showing data normally, so something is wrong with MQTT. Was hoping to not to have to juggle with additional influx/node bs, my device has only one core and 500Mb of ram, and I’d like to conserve those resources as much as possible
I can also confirm that as of Mar 5, 2023, running v9.4.3 OSS and v.1.0.0. beta of the MQTT datasource plugin, the behavior is erratic. Readings are being sent through the broker about once every 3 seconds. Grafana displays 5 readings and then goes blank.
MQTT works for some time, than it stops suddenly and “NO DATA” is displayed
I see as well, that can be dependent on the topic, If I delete the topic and take a new one, it works for a couple of seconds and then goes blank again…
Unfortunately this is not a solution for me. I’d like to mix live data from influx database and MQTT in one panel. For that the refresh time is either 5s or 1s…
As soon as I set a refresh time, I get no data…
Hi, same behaviour here. I’m running 9.4.7 with MQTT plugin v.1.0.0.
So far no data is displayed.
URI string looks like: tcp://ipaddress:1883, Grafana says ‘MQTT connected’.
Can verify data being published once every 5 seconds with different MQTT client.
Topic looks like this: /firsttopic/secondtopic/thirdtopic/value - maybe the plugin can’t handle the initial backslash?
Changing the time selector and refresh did not change anything.
I had the same issue, sometimes it stops for some reason. For me it worked to change the topic to a shorter one. could be that the MQTT plugin restarts communication when this is done and this fixed the problem, at least for now …