Hello everyone, we have signedup for grafana cloud and have intregated apm, and aws monitoring. Currently we are on free tier which has a limit of 10k series. When i checked my current usage in billing section, its showing 30k metrics, but when i went to prometheus query editor and try to find all the metrics i have used so far its accounting for only 6-7k metrics. There’s not enough clarity on how did the usage arrive at 30k number and what caused it. If anyone has any idea on this, Please let us know
Metric != timeseries.
One metric (e.g. cpu{}) can have multiple timeseries (e.g. cpu{host="A"}, cpu{host="B"}, ...). How do you calculate the number of metrics and timeseries?
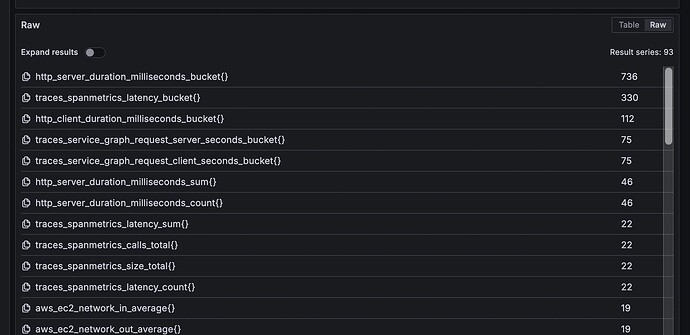
i ran a query to get the top 100 jobs thats consumed most timseries in last 30 days(its been less than 10 days since i’ve signedup) and it gave me the result in screenshot but in billing page you can see usage as 30k series
Why you didn’t show that query/used datasource/…? How do you know that’s a correct query for your use case?
Show timeseries graph for last 30 days for query on your prom datasource pls:
![]() it’s very expensive PromQL query - it may kill your metric server
it’s very expensive PromQL query - it may kill your metric server
count by (__name__)({__name__=~".+"})
topk(100, count by (name)({name=~“.+”}))
this is the query i used
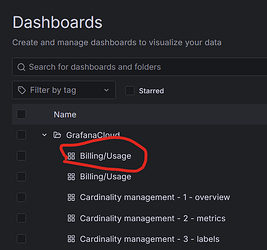
Find your billing dashboards and show your billable metrics/timeseries and your DPM.,pls


