Hi, I’ve a Grafana deployed using kube-promethus-stack.
Grafana version is: Grafana v11.6.1 (ae23ead4d9)
Chart version: 71.1.0
I’ve added multiple Alert rules in Grafana, both with terraform code and from UI, but the alert rules are stuck in the “Creating” state
From the Grafana logs I see these warning logs:
logger=ngalert.api t=2025-05-08T12:37:57.126825703Z level=warn msg=“Failed to get user by uid. Defaulting to an empty name” uid=service error=“user not found”
but following the suggestion in the documentation I checked datasources used in alert rules and they matched the requirement.
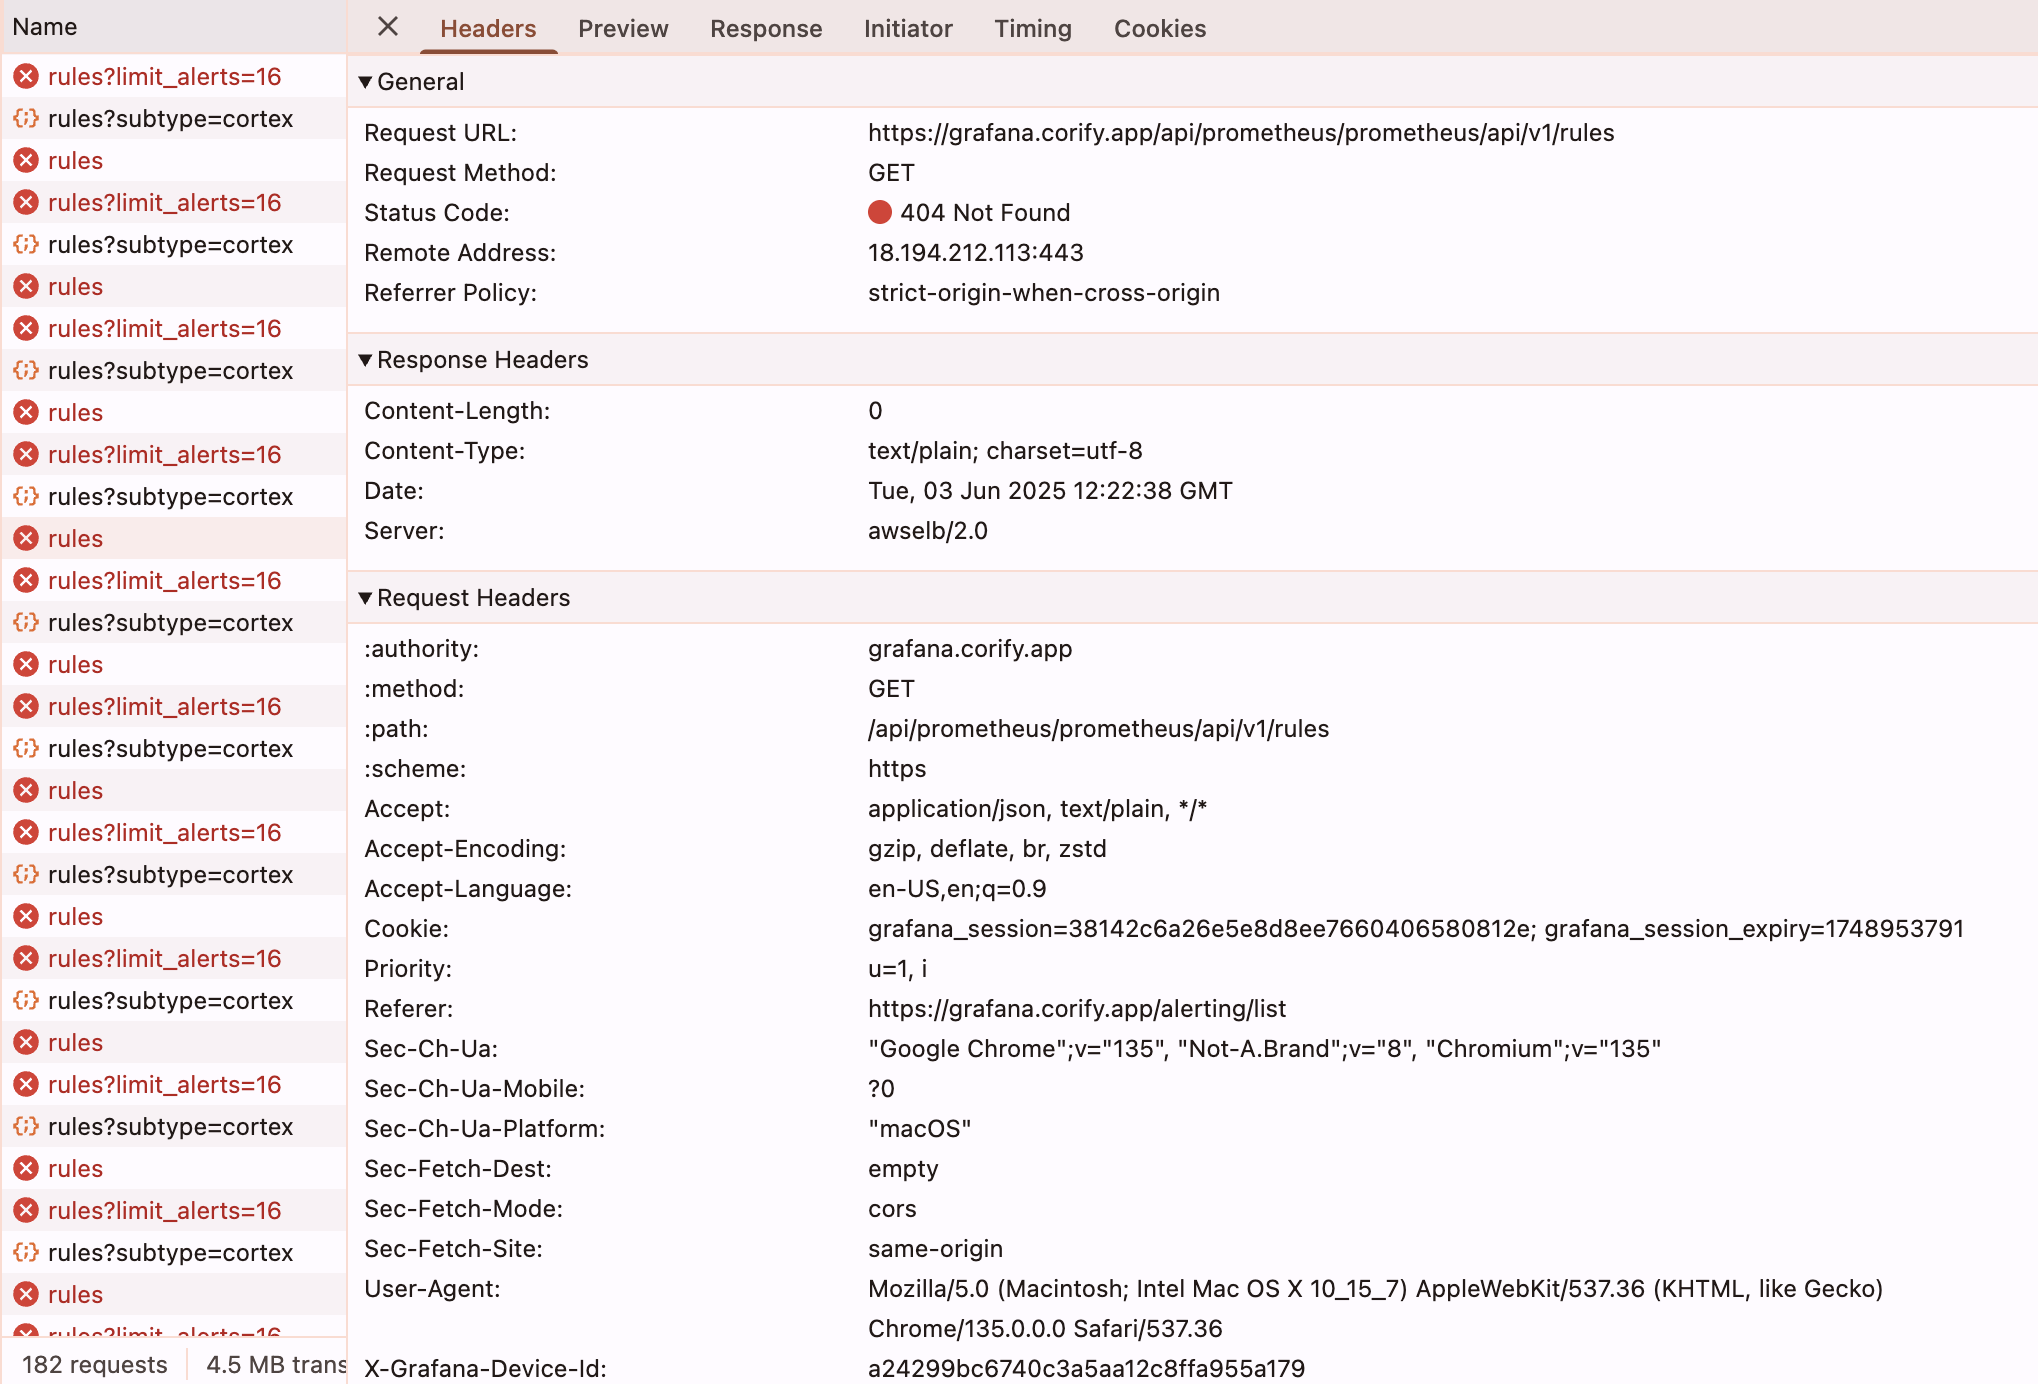
In the Alert rules page I am also getting these errors:
but as far as I know the ruler API is enabled, I am just not sure if Grafana is querying the endpoint correctly
this is a red herring. It means that user that provisioned your rules could not be found, which should not happen unless the user was deleted.
This situation usually happens when rule evaluator state does return rules that exist in database. Try open Dev tools in the browser and check what request /api/prometheus/grafana/api/v1/rules returns. It should contain those rules.
Also, what evaluation interval of those rules?
@yuriy.tseretyan
Thanks for your feedback. I’ve attached screenshots from the errors I see in the dev tools. I don’t see any rules being returned there. Could this be related to how UI is querying for the alert rules? The rules were added most probably using the admin user, but the Grafana deployment has been rolled many times. I wonder if that could cause it?
Those errors do not look relevant either. Please switch to “Network” tab and check GET requests that have path /api/prometheus/grafana/api/v1/rules.
Hi Yuriy,
Here is a sample request from the network tab