Cannot see the alerts on grafana UI after creating via REST API

Hi Grafana Team,
My grafana instance is on v9.3.6, I tried creating an alert (POST) from postman via “AlertingProvisioning” REST API. The alert got created as you can see below postman 201 response code. I can also “GET” the created alert from postman. However, I cannot see this alert on dashboard 1) Either under Alert Rules UI or 2) Not even in the panel section where the alert was linked to. It is just puzzling to me why this is happening. Is there some known issue on this version of grafana ?


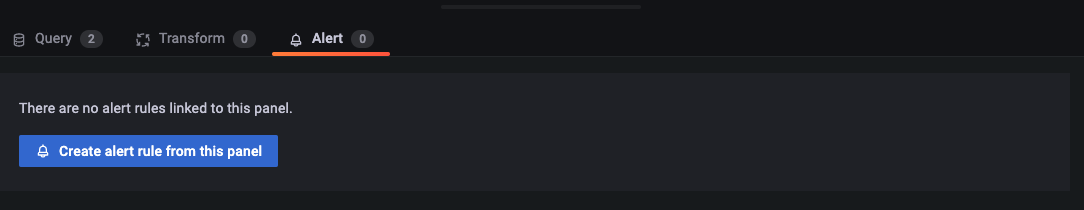
As you can see below: Alert section created under specific panel is empty. I can’t see any alert on UI.

neither under “Alert Rules” section::

alert body:

{ 
"uid": "Banff-services-Restarts-Australia",
    "orgID": 1,
    "title": "Banff-services-Restarts-Australia",
    "condition": "A",
    "data": [
        {
            "refId": "A",
            "queryType": "",
            "relativeTimeRange": {
                "from": 0,
                "to": 0
            },
            "datasourceUid": "-100",
            "model": {
                "type": "classic_conditions",
                "refId": "A",
                "conditions": [
                    {
                        "evaluator": {
                            "params": [
                                2
                            ],
                            "type": "gt"
                        },
                        "operator": {
                            "type": "and"
                        },
                        "query": {
                            "params": [
                                "B"
                            ]
                        },
                        "reducer": {
                            "type": "max"
                        }
                    },
                    {
                        "evaluator": {
                            "params": [
                                2
                            ],
                            "type": "gt"
                        },
                        "operator": {
                            "type": "or"
                        },
                        "query": {
                            "params": [
                                "C"
                            ]
                        },
                        "reducer": {
                            "type": "max"
                        }
                    }
                ]
            }
        },
        {
            "refId": "B",
            "queryType": "",
            "relativeTimeRange": {
                "from": 300,
                "to": 0
            },
            "datasourceUid": "id_Australia-Prometheus",
            "model": {
                "expr": "sum(rate(kube_pod_container_status_restarts_total{namespace=\"central-australia\",container=\"zc-banff-onboarding\"}[1h]) * 3600)",
                "interval": "",
                "legendFormat": "",
                "refId": "B"
            }
        },
        {
            "refId": "C",
            "queryType": "",
            "relativeTimeRange": {
                "from": 300,
                "to": 0
            },
            "datasourceUid": "id_Australia-Prometheus",
            "model": {
                "expr": "sum(rate(kube_pod_container_status_restarts_total{namespace=\"central-australia\",container=\"zc-banff-subscriber\"}[1h]) * 3600)",
                "interval": "",
                "legendFormat": "",
                "refId": "C"
            }
        }
    ],
    "noDataState": "NoData",
    "execErrState": "Alerting",
    "for": "5m",
    "annotations": {
        "__alertId__": "531",
        "__dashboardUid__": "EKS-Banff-Australia",
        "__panelId__": "35"
    },
    "labels": {
        "alertname": "Banff-services-Restarts-Australia",
        "rule_uid": "Banff-services-Restarts-Australia"
    }
}

hi @harish422 :wave:

make sure the following is present in your JSON body:

id
empty value for uid
orgID
folderUID
unique title

sample JSON:

{
    "id": 55,
    "uid": "",
    "orgID": 1,
    "folderUID": "eKZgpEbVz",
    "title": "my_super_test",
...  
}

Hi @antonio . I am using all the fields you mentioned , still I am facing the same issue .I think that the alert rules will be visible only if we give the folderuid of an existing folder in alert rules , we cant create one?
But I need to create a new folder and import the alert rules , how can i achieve this?

“annotations”: {
“runbook_url”: “https://supercoolrunbook.com/page/13
},
“condition”: “A”,
“data”: [
{
“refId”: “A”,
“relativeTimeRange”: {
“from”: 600,
“to”: 0
},
“datasourceUid”: “eyvBfiRVk”,
“model”: {
“datasource”: {
“type”: “prometheus”,
“uid”: “eyvBfiRVk”
},
“editorMode”: “builder”,
“expr”: “inventory_runtime{app="inventory"}”,
“hide”: False,
“intervalMs”: 1000,
“legendFormat”: “__auto”,
“maxDataPoints”: 43200,
“range”: True,
“refId”: “A”
}
},
{
“refId”: “B”,
“relativeTimeRange”: {
“from”: 600,
“to”: 0
},
“datasourceUid”: “-100”,
“model”: {
“conditions”: [
{
“evaluator”: {
“params”: [
0,
0
],
“type”: “gt”
},
“operator”: {
“type”: “and”
},
“query”: {
“params”:
},
“reducer”: {
“params”: ,
“type”: “avg”
},
“type”: “query”
}
],
“datasource”: {
“name”: “Expression”,
“type”: “expr”,
“uid”: “expr
},
“expression”: “A”,
“intervalMs”: 1000,
“maxDataPoints”: 43200,
“reducer”: “max”,
“refId”: “B”,
“settings”: {
“mode”: “”
},
“type”: “reduce”
}
},
{
“refId”: “C”,
“relativeTimeRange”: {
“from”: 600,
“to”: 0
},
“datasourceUid”: “-100”,
“model”: {
“conditions”: [
{
“evaluator”: {
“params”: [
2400
],
“type”: “lt”
},
“operator”: {
“type”: “and”
},
“query”: {
“params”: [
“C”
]
},
“reducer”: {
“params”: ,
“type”: “last”
},
“type”: “query”
}
],
“datasource”: {
“type”: “expr”,
“uid”: “-100”
},
“expression”: “B”,
“hide”: False,
“intervalMs”: 1000,
“maxDataPoints”: 43200,
“refId”: “C”,
“type”: “threshold”
}
},
{
“refId”: “D”,
“relativeTimeRange”: {
“from”: 0,
“to”: 0
},
“datasourceUid”: “-100”,
“model”: {
“conditions”: [
{
“evaluator”: {
“params”: [
0,
0
],
“type”: “gt”
},
“operator”: {
“type”: “and”
},
“query”: {
“params”:
},
“reducer”: {
“params”: ,
“type”: “avg”
},
“type”: “query”
}
],
“datasource”: {
“name”: “Expression”,
“type”: “expr”,
“uid”: “expr
},
“expression”: “$B/60”,
“hide”: False,
“intervalMs”: 1000,
“maxDataPoints”: 43200,
“refId”: “D”,
“type”: “math”
}
}
],
“execErrState”: “OK”,
“folderUID”: “cH-c5wZ4znn”,
“for”: “2h”,
“id”: 77,
“isPaused”: False,
“labels”: {
“team”: “sre-team-1”
},
“noDataState”: “Alerting”,
“orgID”: 1,
“provenance”: “string”,
“ruleGroup”: “eval_group_1”,
“title”: “Alwaysnewfiring”,
“uid”: “”,
“updated”: “2023-10-11T09:53:16.995Z”

I see that the body of the JSON I send is different.

{
    "id": 67,
    "uid": "",
    "orgID": 1,
    "folderUID": "eKZgpEbVz",
    "ruleGroup": "another group",
    "title": "my_super_test666",
    "condition": "B",
    "data": [
        {
            "refId": "A",
            "queryType": "",
            "relativeTimeRange": {
                "from": 600,
                "to": 0
            },
            "datasourceUid": "mnOkAJt4k",
            "model": {
                "hide": false,
                "intervalMs": 1000,
                "maxDataPoints": 43200,
                "refId": "A"
            }
        },
        {
            "refId": "B",
            "queryType": "",
            "relativeTimeRange": {
                "from": 0,
                "to": 0
            },
            "datasourceUid": "-100",
            "model": {
                "conditions": [
                    {
                        "evaluator": {
                            "params": [
                                3
                            ],
                            "type": "gt"
                        },
                        "operator": {
                            "type": "and"
                        },
                        "query": {
                            "params": [
                                "A"
                            ]
                        },
                        "reducer": {
                            "params": [],
                            "type": "last"
                        },
                        "type": "query"
                    }
                ],
                "datasource": {
                    "type": "__expr__",
                    "uid": "-100"
                },
                "expression": "A",
                "hide": false,
                "intervalMs": 1000,
                "maxDataPoints": 43200,
                "refId": "B",
                "type": "classic_conditions"
            }
        }
    ],
    "updated": "2023-03-27T12:21:37+02:00",
    "noDataState": "NoData",
    "execErrState": "Error",
    "for": "5m",
    "isPaused": false
}

I would advise to first GET an existing alert rule from your Grafana instance.

GET /api/v1/provisioning/alert-rules/{UID}

Then, modify the following elements of the JSON:

result:

tip: If you add the X-Disable-Provenance header to your request , you will keep the imported alert rule editable in the UI

Check if the alert rules are properly associated with the panels. Also, ensure compatibility with your Grafana version and consider reaching out to Master Mod and Grafana support for assistance.