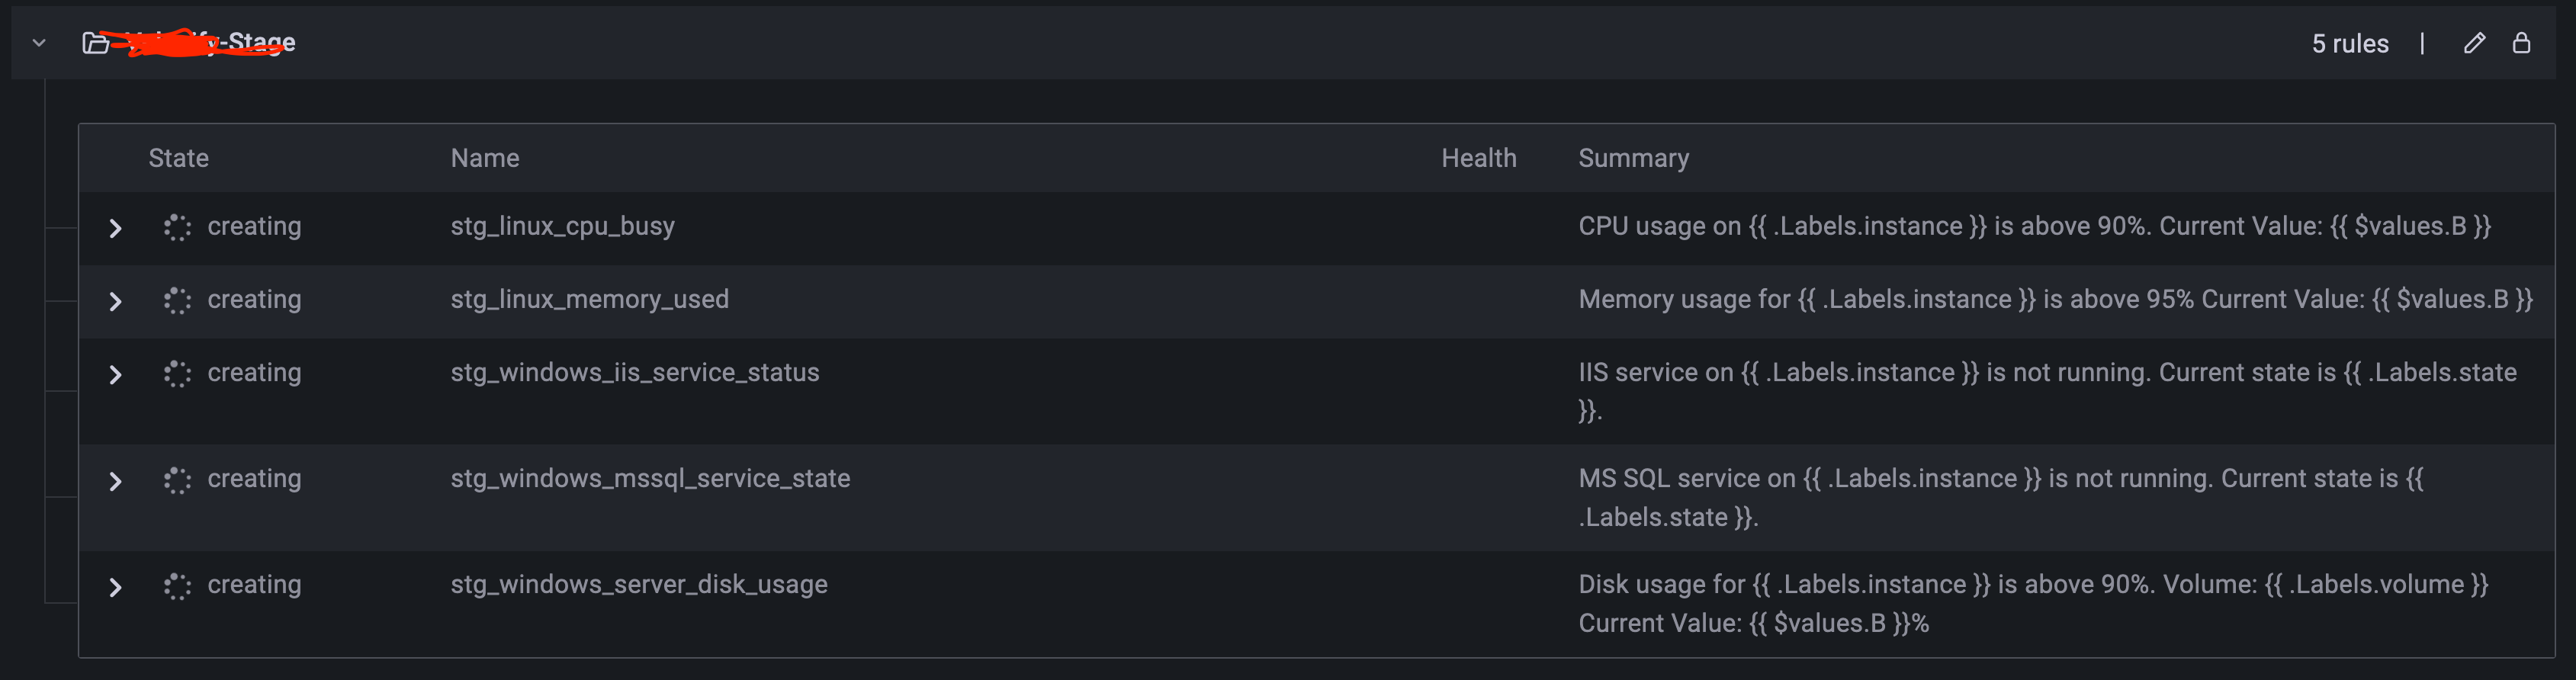
I have been having issues with Grafana managed alerts not loading state. The page just shows “Loading…” at the top, and if I go into folders it shows “Creating…” for state.
Logs don’t show any errors. I am running this via kube-prometheus-stack helm chart. This has occurred across multiple helm chart versions which encompass Grafana versions 8.4.x through to 9.0.5.
I am able to interact with the alerts, run queries, preview alerts, update them, etc.

Update:
Finally got an error in the UI:
Errors loading rules
Failed to load Grafana rules state: Request was aborted
This seems to be similar to though I’m not using Loki: [Grafana v8] Errors loading rules Failed to load rules state from Loki: 404 page not found · Issue #36091 · grafana/grafana · GitHub