Hello there,
I am using grafana-loki for my company. We have multiple servers with loki and promtail configured with docker-compose. In grafana ,we have mutiple datasources with loki for all the different servers. I am trying to configure a datasource variable for all servers that have loki but I couldn’t find a solution. To explain more , in the image coming I created a new variable(app) with type of datasource and then I selected Loki in datasource options. And in the blue section are all my servers that have Loki.
Then in the dashboard when I select for example 3 servers and the dashboard does not updates.
I don’t know what I do wrong. I tried also other types of variables but I think that are not global(for multiple servers with loki). Do you have any suggestions? I am really thankful for all ideas!!
Yes, but there are no results. Where do I have to put the variable? In the datasource section, in the label or in the value? I think in the datasource, but I tried all the different methods and I have no result. What else should I do?
Since your variable is meant to be used as data source, then yes you should use that variable in your data source part of dashboard. Can you link a screenshot of one of your dashboard configuration?
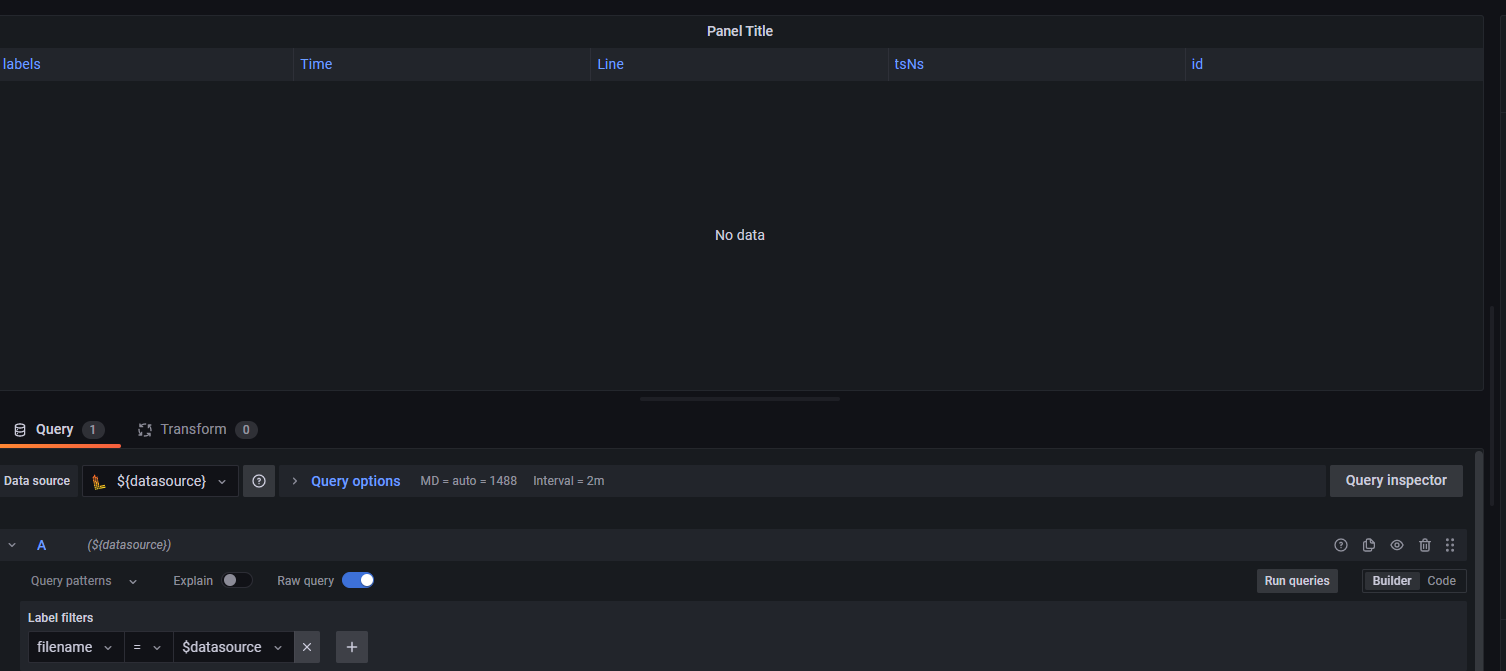
In the label section I have 3 options: job, filename and $datasource
In the value section I have again the datasource option along with the option in case I choose job or filename.
In case I choose job with $datasource as value I have no data, the same thing happens with filename and $datasource.
Looking at your second screenshot, you have the ${datasource} in the Data source section, that looks correct. But you also have it in your query {filename="$datasource"}, that looks incorrect, unless the filename in your log indeed matches datasource. Maybe try changing the query to something like {filename~=".+"} for testing purpose.
That’s what you were looking for, wasn’t it? To be able to select different data source based on variable? If not, perhaps clarify your question a bit.
I am sorry for the misunderstanding.
I want to have one dashboard and from there to see all the logs from all my servers. Is that possible?
In the most servers I have 2 jobs: varlogs and containerlogs.
The datasousrce variable shows logs only from one loki instance that means just from one server. It can not take logs from at least two servers. I don’t know the reason this is happening.