online
January 19, 2018, 10:05am
1
Use helm installed Prometheus and Grafana on minikube at local.
$ helm install stable/prometheus
$ helm install stable/grafana
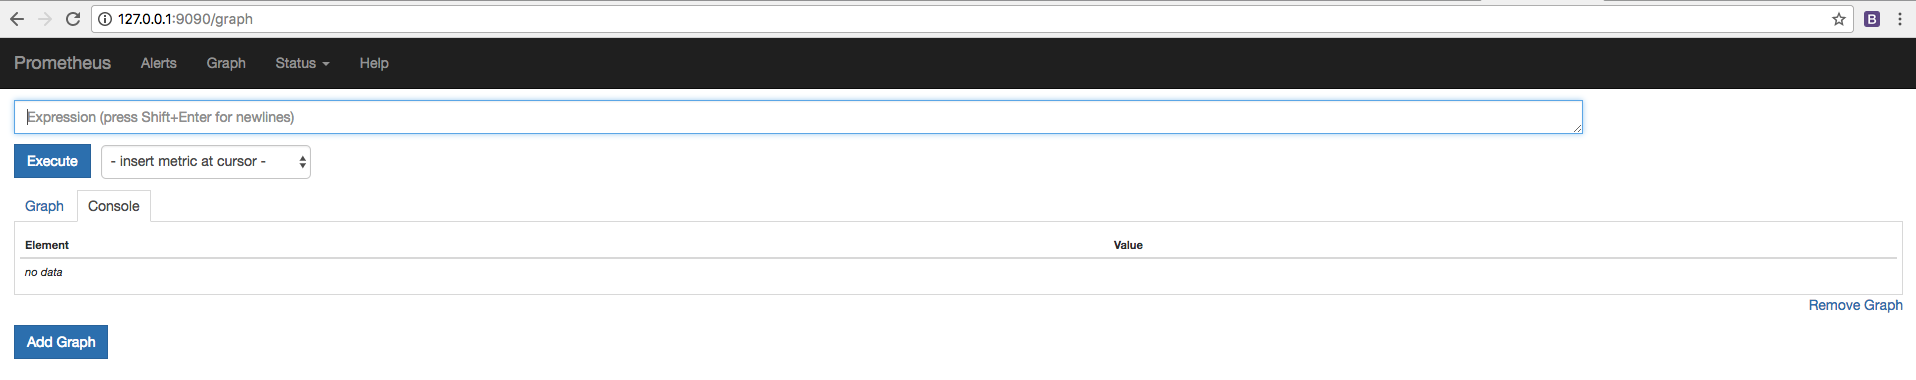
Prometheus server, alertmanager grafana can run after set port-forward:
$ export POD_NAME=$(kubectl get pods --namespace default -l "app=prometheus,component=server" -o jsonpath="{.items[0].metadata.name}")
$ kubectl --namespace default port-forward $POD_NAME 9090
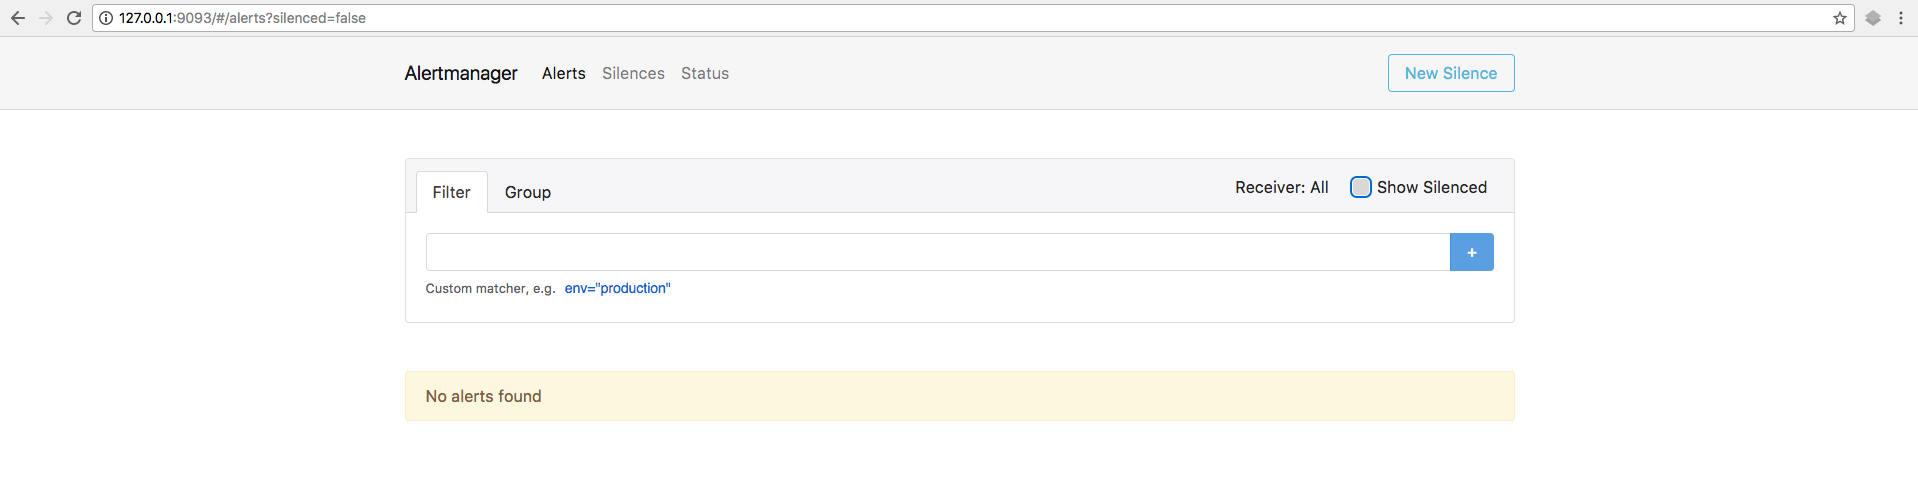
$ export POD_NAME=$(kubectl get pods --namespace default -l "app=prometheus,component=alertmanager" -o jsonpath="{.items[0].metadata.name}")
$ kubectl --namespace default port-forward $POD_NAME 9093
$ export POD_NAME=$(kubectl get pods --namespace default -l "app=excited-crocodile-grafana,component=grafana" -o jsonpath="{.items[0].metadata.name}")
$ kubectl --namespace default port-forward $POD_NAME 3000
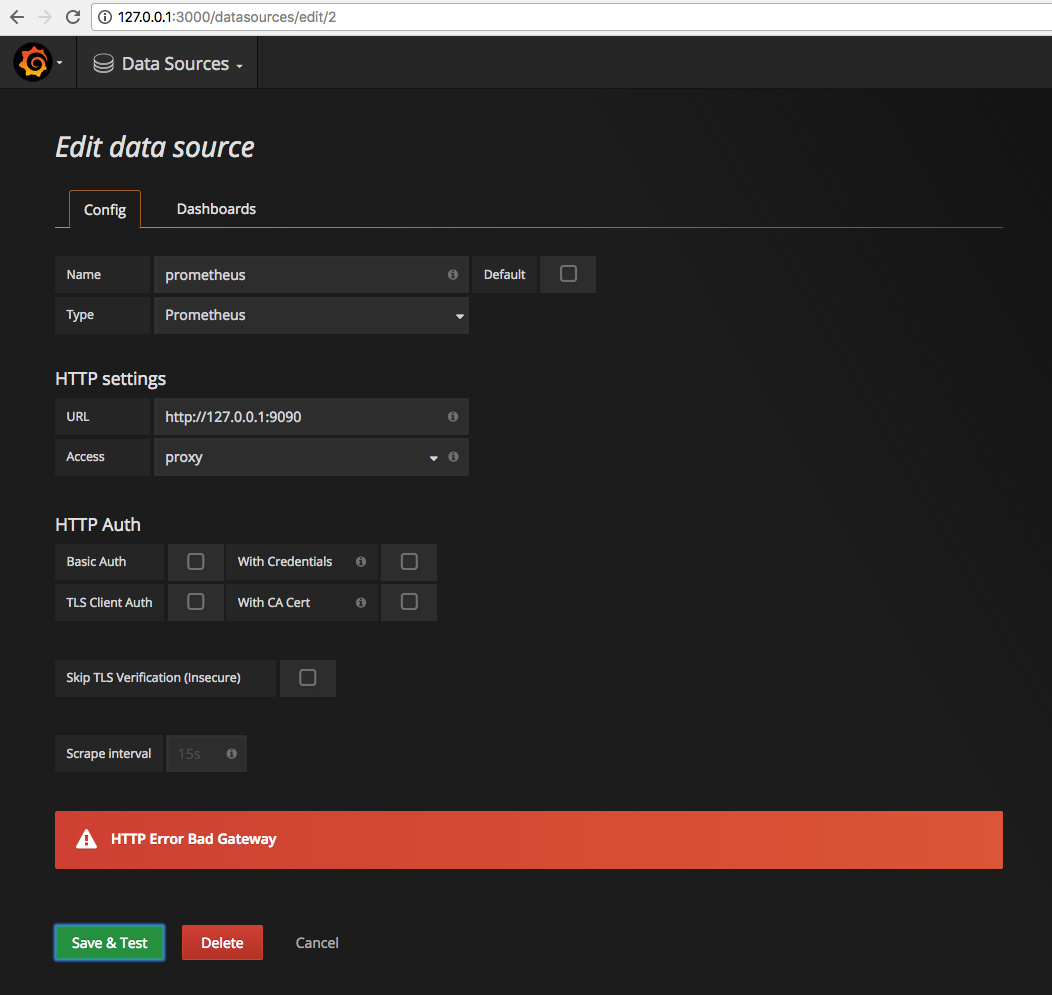
Add Data Source from grafana, got HTTP Error Bad Gateway error:
Import dashboard 315 from:
Kubernetes cluster monitoring (via Prometheus) | Grafana Labs
Then check Kubernetes cluster monitoring (via Prometheus), got Templating init failed error:
Why?
Hi,
I think you need to use the internal ip of prometheus when setting up data source. The port forward you setting up is only for your computer.
Marcus
online
January 23, 2018, 7:38am
3
Thank you. I changed Access from proxy to direct, it works.
Okay.
Please note that problems may arise related to direct access, for example if you’re planning on using the alerting feature in Grafana.
Marcus
online
January 23, 2018, 8:54am
5
Good. So it seems that the internal ip of prometheus is the best way.
Yes. Last time I used kubernetes with helm, grafana and prometheus I could see the hostname in kubernetes somewhere placed as a label which I could then reference in Grafana to connect to prometheus. Suggest you look this up in helm community.
Marcus
online
January 23, 2018, 8:59am
7
Okay, thank you very much for your answer and your help!
brunop
October 1, 2020, 2:54pm
8
Hi,Prometheus and Grafana at local.