Grafana Bar Chart X-Axis Configuration

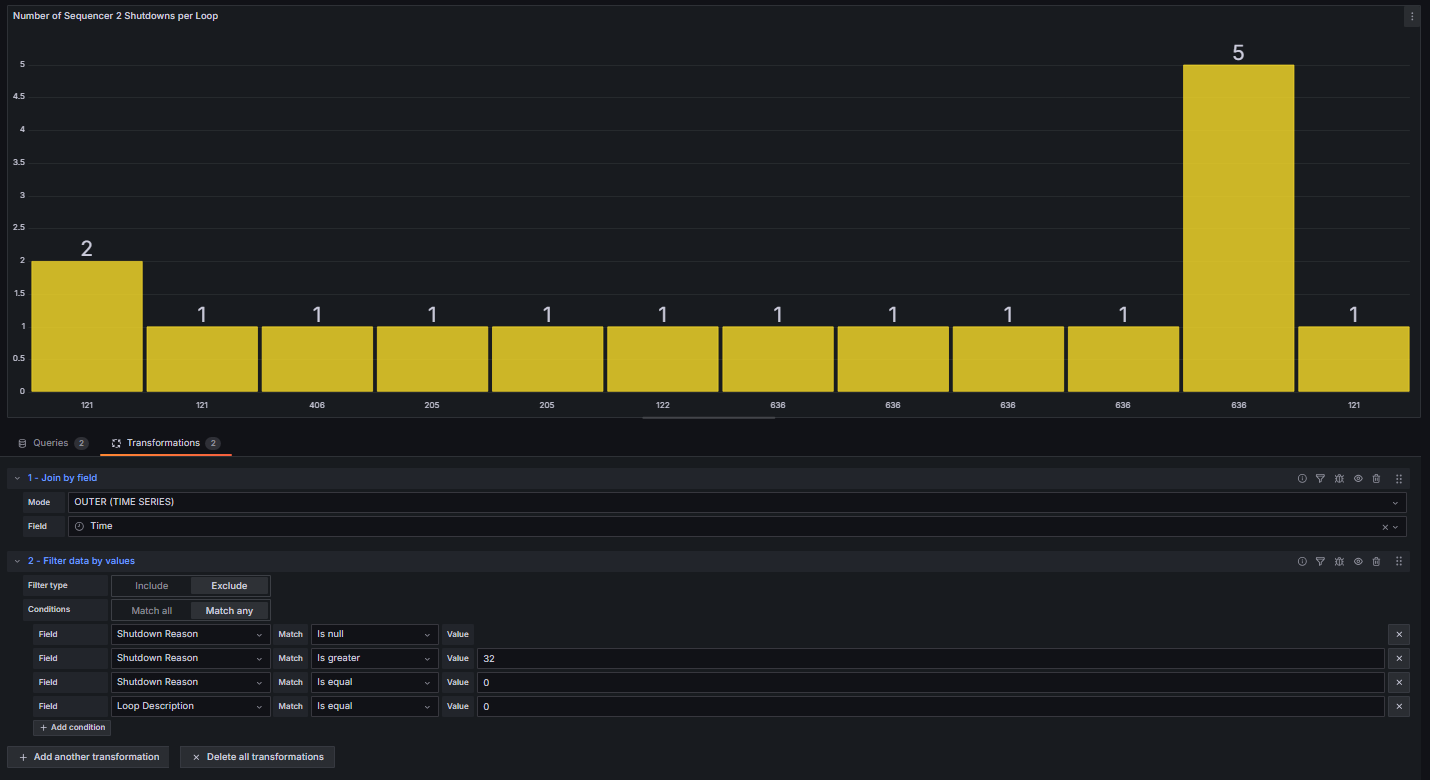
I have a bar chart that is tracking system loop numbers and how many shutdowns happened during each loop. The panel is accomplishing that which is great, but I’d ideally like to remove the duplicate values. So, for example, instead of five “636” columns, is there a way to combine it into just one “636” column?

I’m using Grafana Cloud v11.3.1 with an InfluxDB_SODA data source.

You can do this by creating a query like this.


Or you can also do this by using the Group By transform.

Thanks for the reply! I really appreciate the help!

Since my data source is InfluxDB_SODA, I can’t use SQL.

This is what my set up looks like:

These are the Transformations I’ve used:

I’ve tried using the “Group by” transformation, but it returns “No numeric fields found”:

Are you using flux or influxql query language? please post your query

I’m using InfluxDB_SODA.

I posted this in my last reply:

This is what the query editor looks like:

1 Like

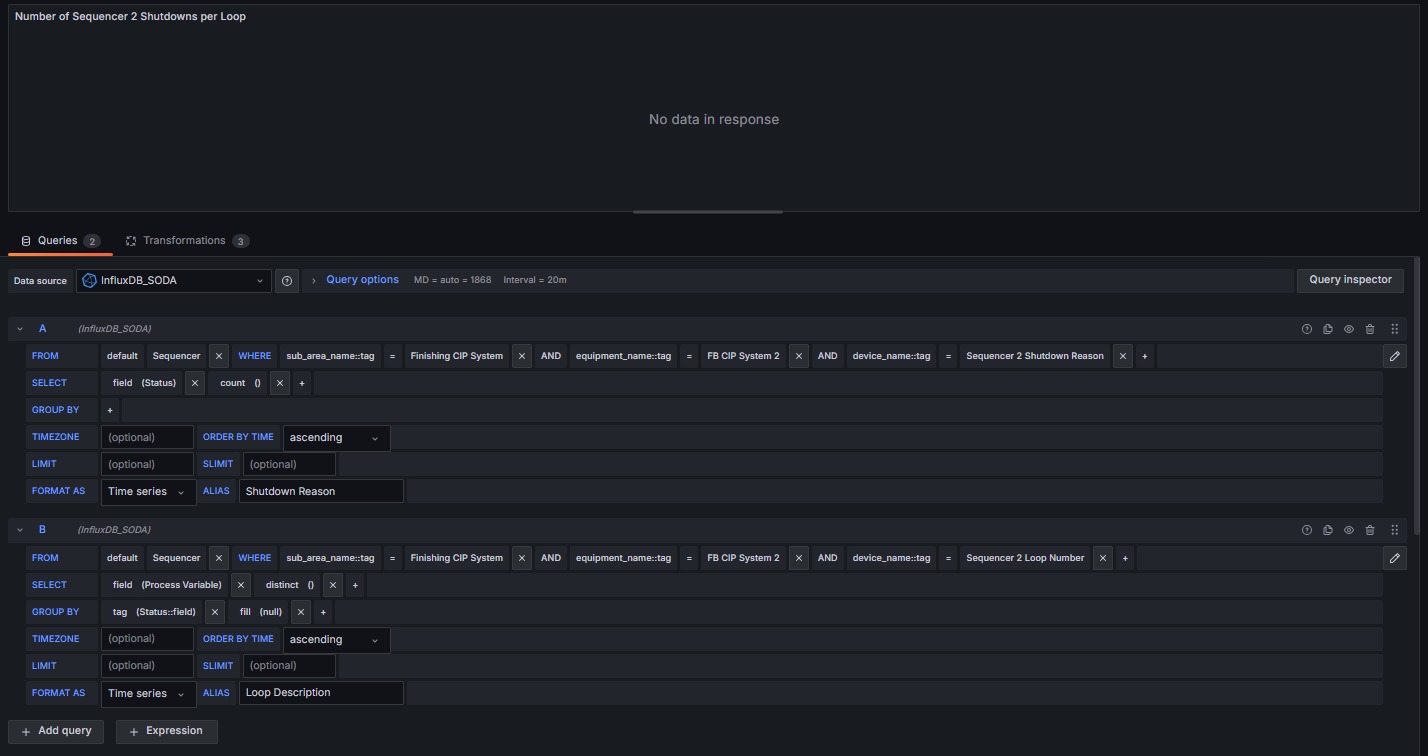
i think the issue might be that you are grouping by time interval, so 636 does appear in different time intervals. most probably do your influxql query to count by Shutdown Reason

I can get rid of the time interval grouping but the other options don’t yield anything. These are the options:

maybe group by tag(Status::field)

it’s more influxql than grafana really

Maybe I set it up wrong?