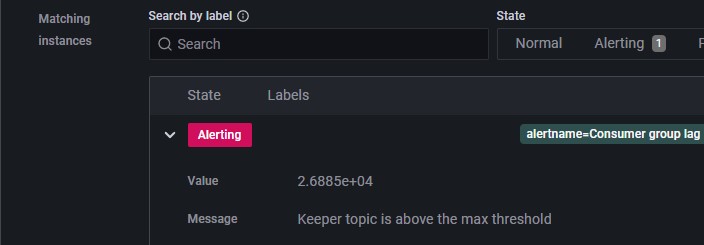
Hello everyone, I am using Grafana v9.3.2 / v9.0.6, both versions show the alert value in the panel as a decimal shortened format (XX.XXXe+03), as shown in the following
I’ve tried to change the unit of the panel to a different value, but it stayed the same.
Is there a way to display a full number format?
We’re querying the Grafana API, and the value is shown in the same format
Actually, the template is showing the normal value by using (.ValueString), but when using the API, or looking at the panel, the value seems to be of that format.
This is working when there is one result of value populated in the output.
If there are multiple values its stripping remaining values in the alert summary
We have this same issue with our alerts and I haven’t been able to find an answer. When you said to add that printf “in your template” were you referring to the template for alert_rules.yml that we are sending over to our Amazon managed Prometheus?
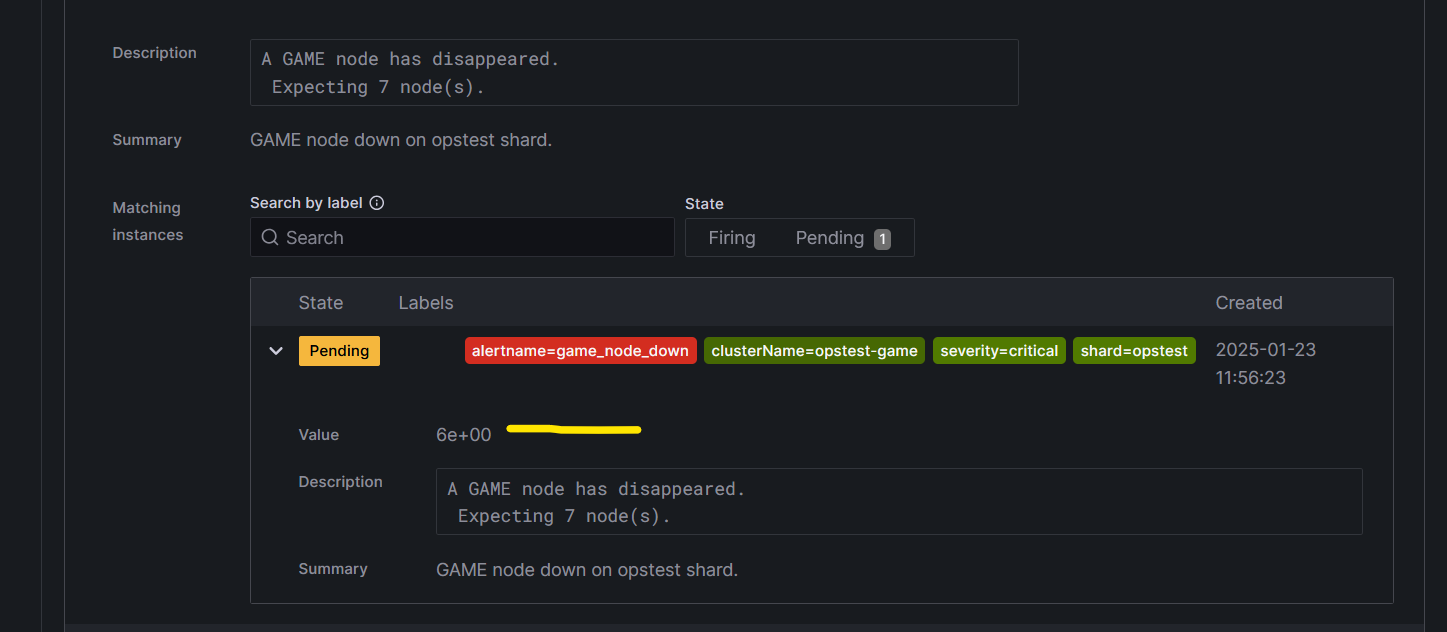
Here’s a sample rule we have,
      - alert: game_node_down
        expr: absent_over_time(pragma_engine_node_alive_total{backendType="GAME"}[2m]) == 1 or count by (clusterName)(group(increase(pragma_engine_node_alive_total{backendType="GAME"}[2m])) by (clusterName,nodeName)) != {{.gameNodeCount}}
        for: 4m
        annotations:
          summary: "GAME node down on {{ .shardId }} shard."
          description: "A GAME node has disappeared.\n Expecting {{ .gameNodeCount }} node(s)."
        labels:
          alertname: game_node_down
          severity: critical
and here’s what I see in Grafana when it’s pending or firing,
No, I was referring to the template text that one creates in the Alert Rules screen (for example, so the content of the Slack alert contains meaningful info). I took it from an alerting tutorial I wrote years ago, so the syntax has changed, but the principle is generally the same.
Thanks! Sorry to resurrect this old convo. I’ll post a new one. Our alerts are made through Pulumi and created in Amazon Managed Prometheus which feeds them over to our Amazon hosted Grafana. Best.