I would like to add that the same happens for MySQL when counting aggregated rows, expecing to alert on >0 in response.
I feel that this should trigger the “No Data” situation for an alert. The error is likely coming from the expression, however the expression does not accept the option for “Result of B has no value.”
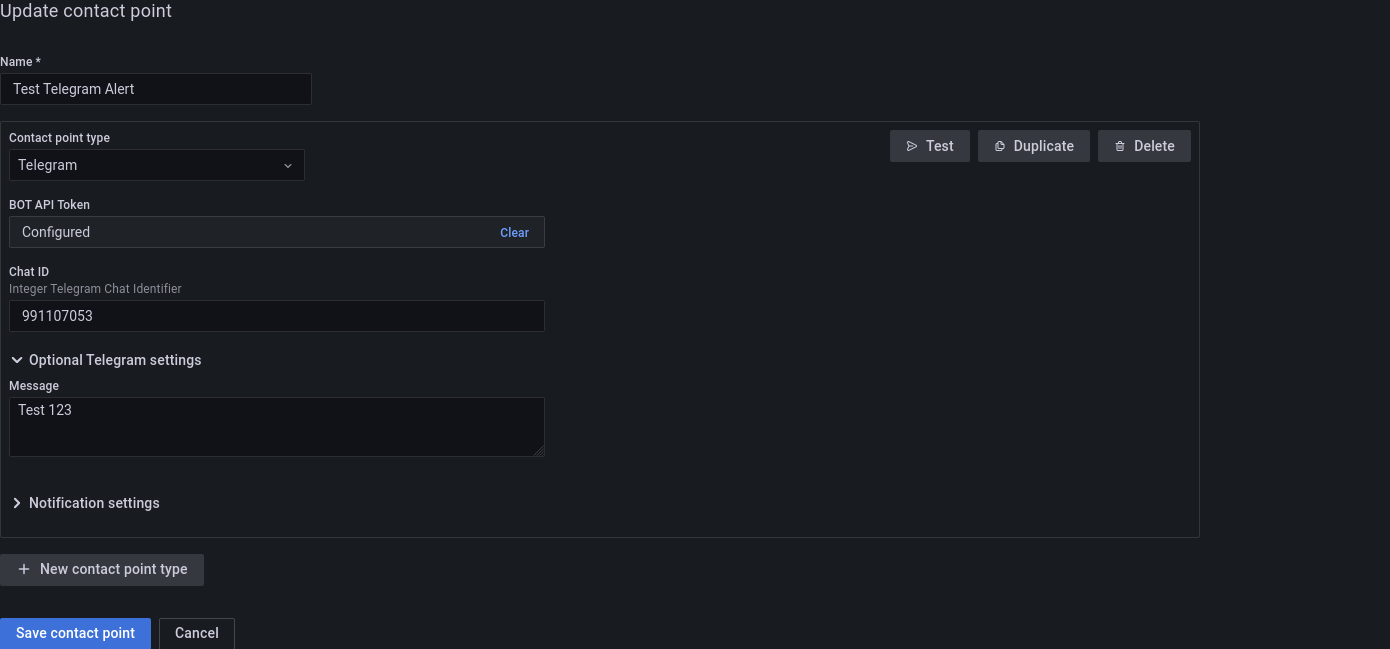
I think the problem could be connected to the message content itself. At least for me (I am using Telegram), grafana seems to attempt to send a message, but ultimately fails to do so (see my logs):
t=2021-12-06T12:36:31+0000 lvl=info msg="sending telegram notification" logger=alerting.notifier.telegram chat_id=991107053
t=2021-12-06T12:36:31+0000 lvl=eror msg="Failed to send webhook" logger=alerting.notifier.telegram error="Webhook response status 400 Bad Request" webhook="Test Telegram Alert"
t=2021-12-06T12:36:31+0000 lvl=info msg="level=error component=dispatcher msg=\"Notify for alerts failed\" num_alerts=1 err=\"Test Telegram Alert/telegram[0]: notify retry canceled due to unrecoverable error after 1 attempts: Webhook response status 400 Bad Request\"" logger=alertmanager org=1
The problem can be “fixed” by setting a custom telegram message:
The query works fine when there is data, but as soon as there is no data returned by the query then we hit the same error message: “Input data must be a wide series but got long (input refid)”
The whole point of the alert is to trigger when there is no data returned, so how can we put it in wide series format??
Exactly the same issue here. Using AWS CloudWatch Logs as data source, to query Error Logs from our Database. But when there are no results (no error logs) the alert breaks.
Specifying the “Alert state if execution error or timeout” seems to omit the problem for us. Meaning, the alert itself is still in “Normal” state, however the “health” of the alert is “ERROR” due to this issue “input data must be a wide series but got type not (input refid)”
Running Grafana Cloud, v8.4.5-56740
UPDATE: nope, speciying the “Alert state if execution error or timeout” does not fix this issue for us.
Same problem here. It seems to have something to do with the format of the input data. To have more control over the input data i’m using the CSV datasource now. I’ve tried all kinds of CSV content, but no luck so far…
Finally found a way to do it, using strcontains and sum functions.
This generates a continuous data set, with 0s when pattern is not found.
fields strcontains(@message, 'Failed to process upserts for table') as is_my_pattern
| stats sum(is_my_pattern) as my_pattern_count by bin(1m) as ts
| sort my_pattern_count desc