Hello, I’m using Grafana 9.3.6 inside a docker container. Grafana query data from Influxdb 1.8 with InfluxQL.
I’ve been using grafana for time series for a long time and works perfect. Now, I’ve decided to store events inside DB and want to view them with Granafana.
As an example, I have the events bellow:
> use diagnostic
Using database diagnostic
> select * from "C1"
name: C1
time                box branch enable global_error port specific_error stop_btn system_status
----                --- ------ ------ ------------ ---- -------------- -------- -------------
1680456642000000000 1   0      true   6            1    6              false    1
> select * from "C2"
name: C2
time                box branch enable global_error port specific_error stop_btn system_status
----                --- ------ ------ ------------ ---- -------------- -------- -------------
1680456642000000000 2   3      true   6            1    6              false    1
I was expecting to see it as is shown above, but formatted in a table. But when I query data, I can’t group each measurement by row.
Here is the result from query:
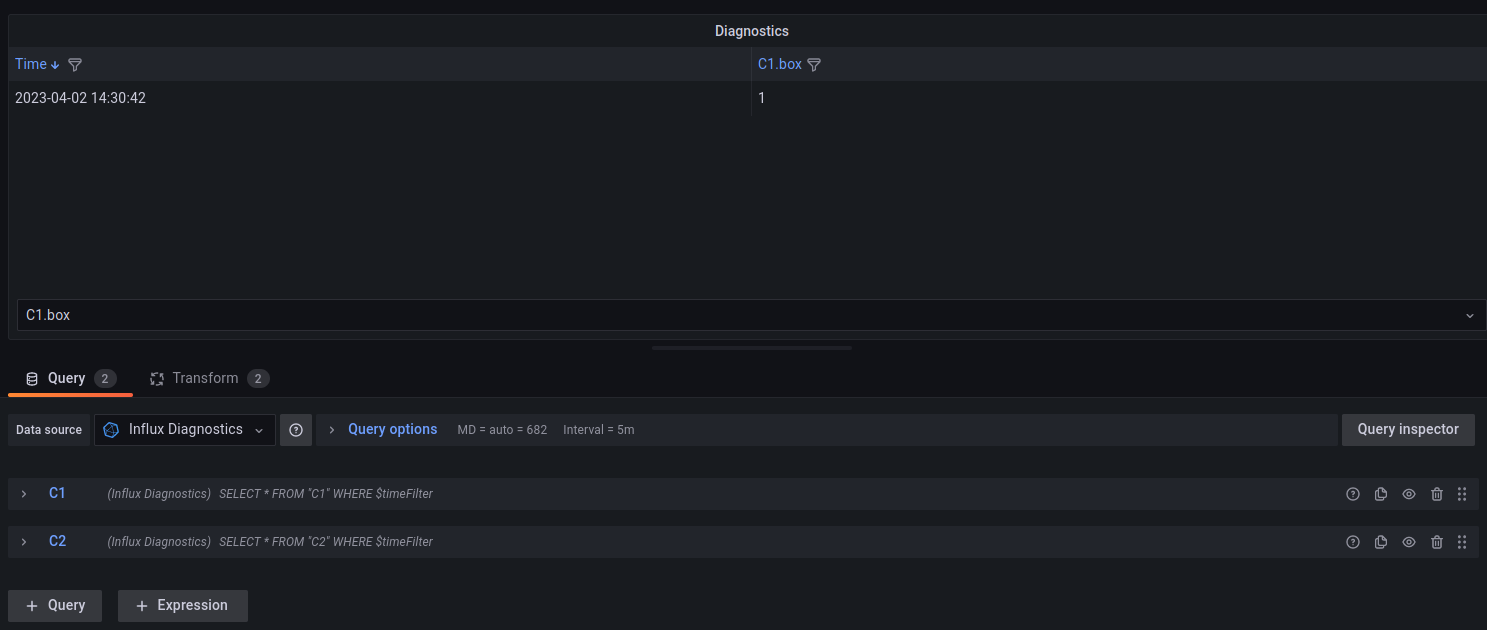
After some reading, probing, I noticed that I can join by filed.
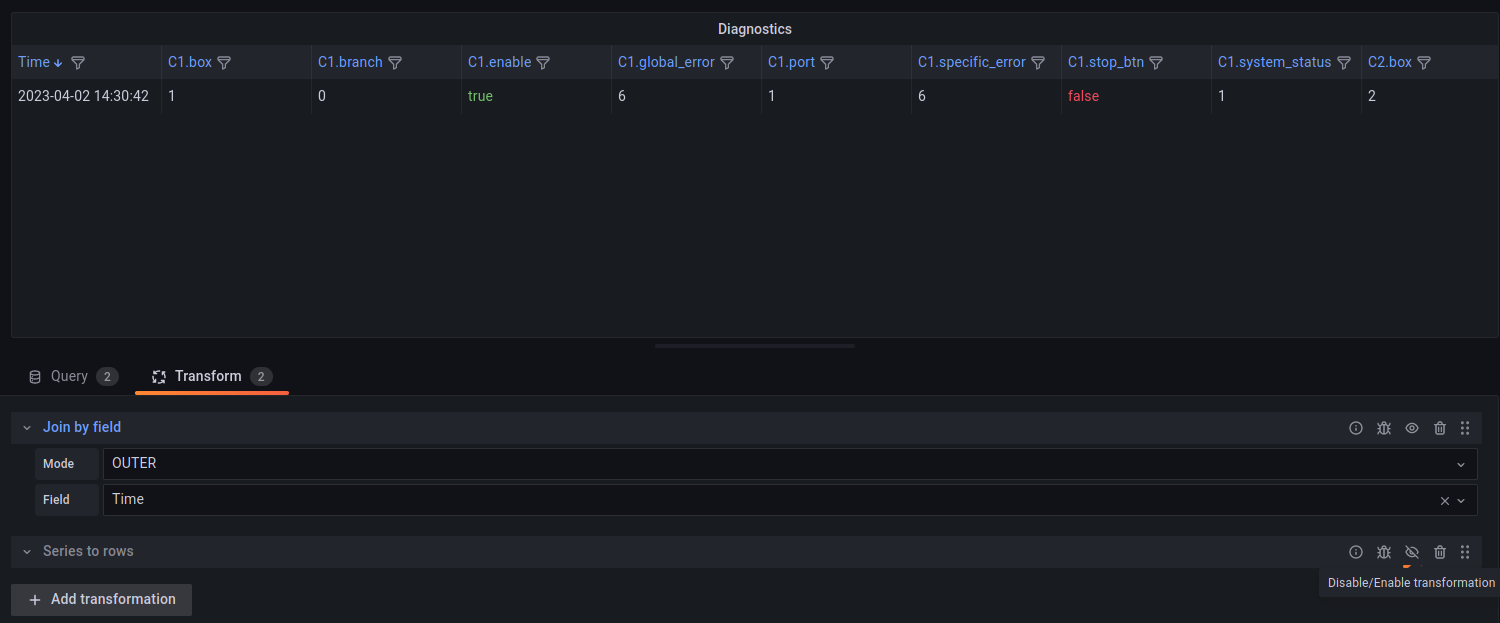
However, I want a measurement by line. Example:
12/02/2023 01:30 | C1 | 1 | 2 | 3 |
12/02/2023 01:32 | C2 | 4 | 5 | 6 |
I’m confused. Can anyone help me?