Filter from one panel to another

Please excuse my “newbie question”. I have been using Power BI and Superset, but love the look and customisability of Grafana.

While we would be using Grafana to visualise our server/network infrastructure, we would also like to use it for BI type visualisation. One feature I enjoy in both Power BI and Superset is the dynamic filtering from one panel to another. An example being, a Pie Chart of product types and being able click on a particular product type in the pie chart and filtering the other panels on the dashboard and only showing data for that particular product type.

Is this possible in Grafana?

Thanks so much!

Andrew

Hi,
You could certainly do that. One question though - would you like to have it all in one dashboard and clicking on one thing would limit everything on the same dashboard or would you like to create an additional dashboard for details of a certain type of product (both are doable).

In the same dashboard

You need to create a variable (dashboard settings → variables) that will have all the types of products you’re about to show. Make sure you tick the “Enable “all” option” - it will be your default option when someone goes into your dashboard. Then have all the queries be dependent on that variable. In that way, when you select another product from the dropdown, all the panels will change to display data only to this product. Now to the “click on a pie chart” part - on every panel that you want to be clickable like that, you need to create a Data Link that will point to the same dashboard you’re currently in but will populate the variable created by you - the link will look something like /d/<your-dashboard-uid>?var-<your created variable name>=${__<something>}&${__url_time_range}.
Where:

  • <your-dashboard-uid> is the dashboard uid of the current dashboard (you’re able to get that from the search bar in your browser).
  • <your created variable name> is the name of the variable you have created and used in every panel
  • ${__<something>} here it’s kinda tricky, because that’s supposed to represent the product your user clicked on and it can be dependent on your query. But when you go to the data links menu and try to add one, just type $ in “link” field (or something like that I don’t really remember) and there will be a pop up with everything you can use in the link - some field should correspond to your product.
  • ${__url_time_range} is there for keeping the same selected period of the dashboard - otherwise the click would reset the range to the default value of the dashboard.

And that should be it.

Another dashboard

In here you create another dashboard that will be a drill down of the product data. In here you’ll also create a variable and make every query depend on it (in the new dashboard). Then in the original dashboard you’ll create data links that will point to the new dashboard, so all you need to change is the dashboard uid.

Some references:

Thanks so much @dawiddebowski , that is super helpful!

Reading your reply, it sounds like the “click on a pie chart” part can only be done on data that is somewhat static (known), not on data that is dynamic (could change over time). Is this correct?

Andrew

In data links you can pass any data returned by the query. If for example your data has field with name “product” you should be able to access this data in data links by using $__data.fields.product (or something similar, when you type $ in the data link field, the popup will appear). Although it’s true that you need to know the name of the field ahead of time, i.e. schema of the data should be constant but the data itself (e.g. different types of product) will be populated accordingly.

Hello @agreenlees ,
After analyzing the issue, I believe I have identified the underlying problem. Please find below the recommended steps that may help resolve it

Step 1. Create the Table and Prepare Sample Data

CREATE TABLE sales (
    id SERIAL PRIMARY KEY,
    sale_date DATE NOT NULL,
    product_type TEXT NOT NULL,
    region TEXT NOT NULL,
    sales_amount NUMERIC(10, 2) NOT NULL
);

INSERT INTO sales (sale_date, product_type, region, sales_amount) VALUES
('2025-08-01', 'Electronics', 'North', 150.00),
('2025-08-02', 'Clothing', 'South', 80.50),
('2025-08-03', 'Furniture', 'East', 230.75),
('2025-08-04', 'Electronics', 'West', 310.20),
('2025-08-05', 'Toys', 'North', 45.99),
('2025-08-06', 'Furniture', 'South', 120.00),
('2025-08-07', 'Clothing', 'East', 60.75),
('2025-08-08', 'Toys', 'West', 90.00),
('2025-08-09', 'Electronics', 'North', 200.00),
('2025-08-10', 'Clothing', 'South', 130.00),
('2025-08-11', 'Furniture', 'East', 210.50),
('2025-08-12', 'Toys', 'West', 77.25),
('2025-08-13', 'Clothing', 'North', 85.00),
('2025-08-14', 'Furniture', 'South', 190.00),
('2025-08-15', 'Electronics', 'East', 400.00),
('2025-08-16', 'Toys', 'West', 60.00),
('2025-08-17', 'Clothing', 'North', 95.00),
('2025-08-18', 'Furniture', 'South', 175.30),
('2025-08-19', 'Electronics', 'East', 250.00),
('2025-08-20', 'Toys', 'West', 49.99),
('2025-08-21', 'Clothing', 'North', 88.75),
('2025-08-22', 'Furniture', 'South', 140.00),
('2025-08-23', 'Electronics', 'East', 300.00),
('2025-08-24', 'Toys', 'West', 55.00),
('2025-08-25', 'Clothing', 'North', 65.00),
('2025-08-26', 'Furniture', 'South', 185.00),
('2025-08-27', 'Electronics', 'East', 280.00),
('2025-08-28', 'Toys', 'West', 69.99),
('2025-08-29', 'Clothing', 'North', 72.00),
('2025-08-30', 'Furniture', 'South', 155.00),
('2025-08-31', 'Electronics', 'East', 260.00),
('2025-08-01', 'Toys', 'North', 42.00),
('2025-08-02', 'Clothing', 'South', 90.00),
('2025-08-03', 'Furniture', 'East', 175.50),
('2025-08-04', 'Electronics', 'West', 330.00),
('2025-08-05', 'Toys', 'North', 50.00),

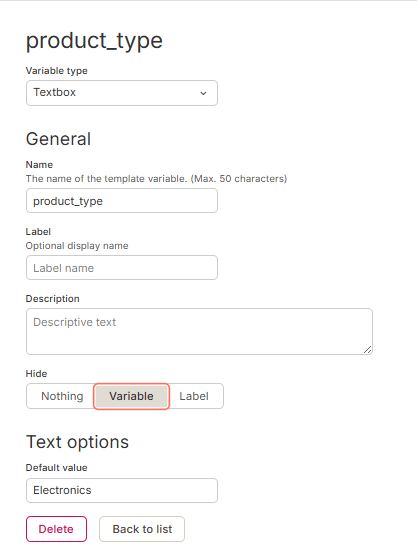
Step 2. Create a Variable for Filtering Based on Product Type

Example variable control to allow filtering the dataset by product category.

Step 3. Panel A – Product Category Selector
This panel allows the user to select a product category dynamically.

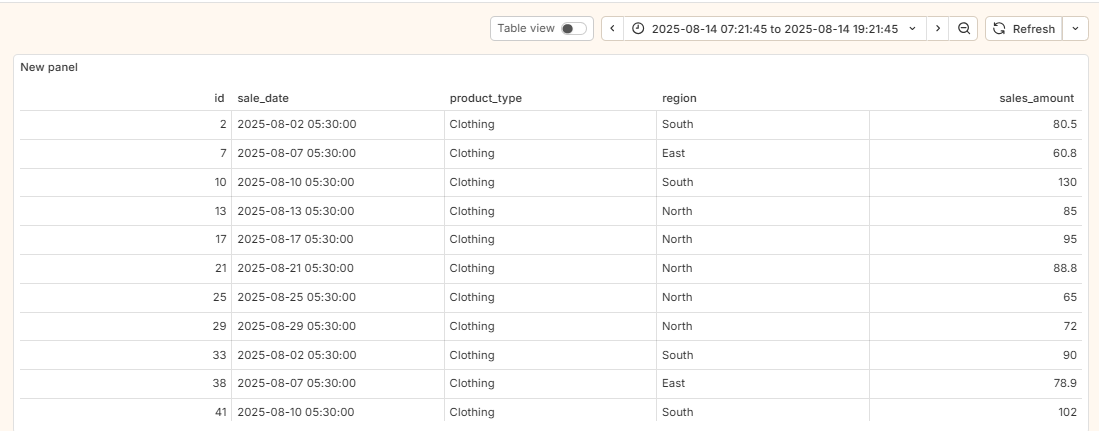
Step 4. Panel B – Filtered Sales Data Display

Step 5. Add a Data Like in Panel A

Step 6. Panel Query
Panel A SELECT product_type FROM sales GROUP BY product_type
Panel B

 SELECT * FROM sales  WHERE product_type = '$product_type'

Final output :-

Hi @agreenlees ,
Just checking in—did this solution resolve your issue, or are you still facing the same problem?