today i found that the exported data from a csv export is not the same which provided by the datasource to the graph panel.
i know that the graph panel make “data tuning” for better visualisation, but my expectation for the CSV export was that the “raw” data will be exported.
Is there a way to achieve this?
What do you mean by “data tuning”? Grafana mostly just shows the data returned from the query (there are a few exceptions like aggregation options in the SingleStat panel).
sorry, you are right. at the visualisation everything works fine
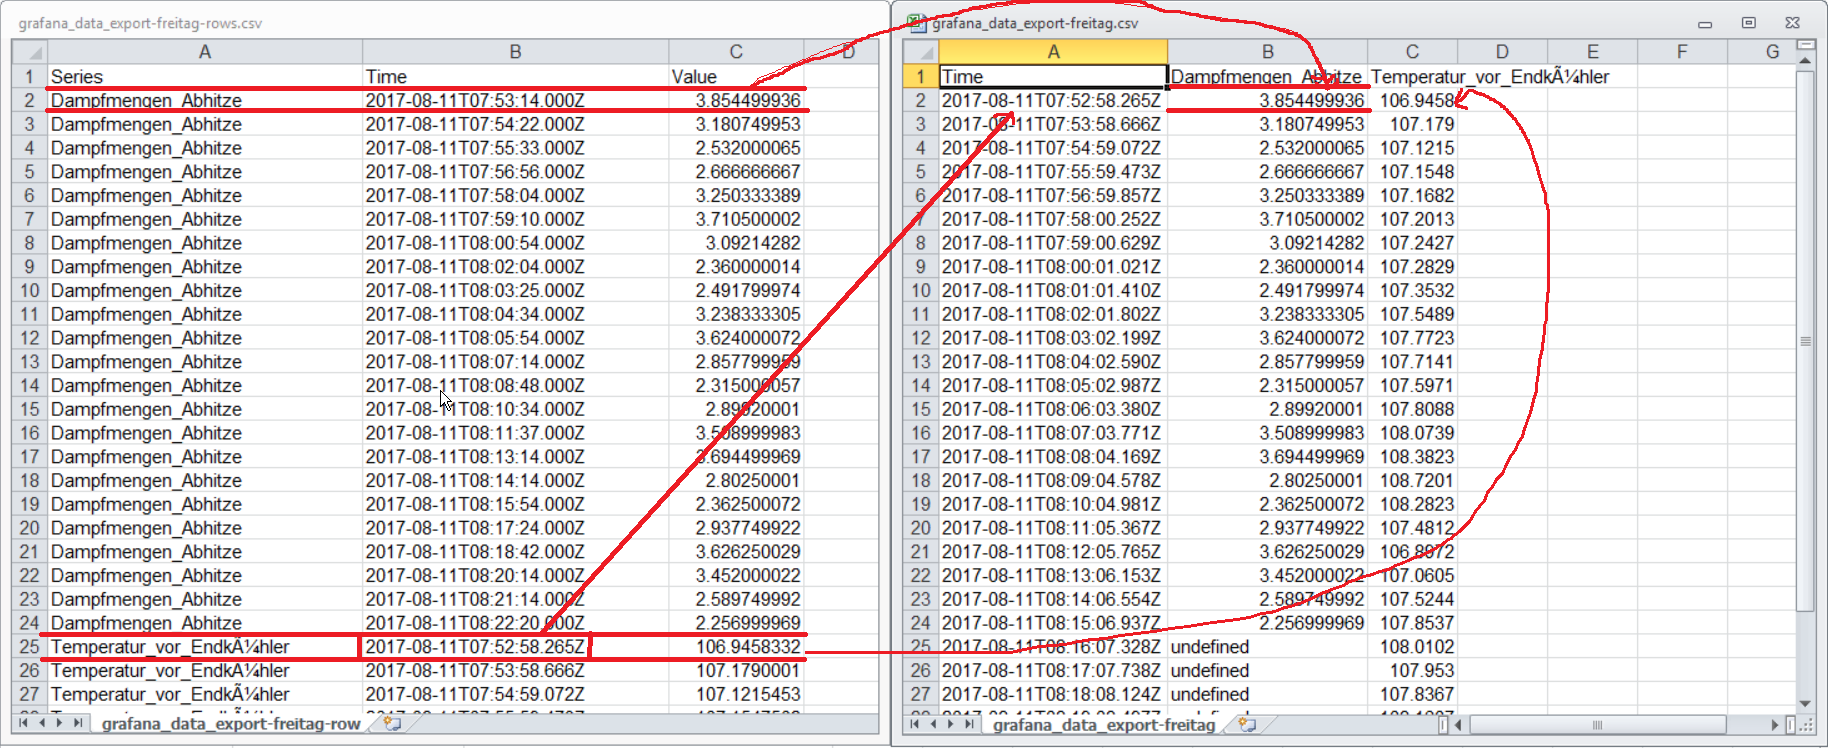
The problem is actualy just exporting data as columns, here are the datapoint not correctly merged.
I attached a screenshot to clarify it with example data.
At the left side shows a correct export as rows, at the right side you see an incorrect export as columns:
i made a new image to clarify it
you can see at the image, that the values from the first time series “dampfmenge abhitze” are set to timestamps of the second timeseries “temperatur vor Endkühler”
Thanks for the explanation. There is a bug report in Grafana that matches this (as there are no other reports, seems like this feature is not used much or this is an unusual bug):
I took a very small sample of data with just a few data points and exported to columns and it was correct.
If you zoom in on your graph and then do an export is the result still incorrect?
We have seen similar problems with data export. We are testing grafana v5.4.2. together with influxdb v1.5.2.
We also tried doing statistical evaluations of measurement time series (10-20s over several weeks). It’s temperature and flow rates (as impulse counts). The flow rate values should be summed up, too.
Our topics:
Basically the trend curves are looking alright (total zoom and zooming in).
But the values of the y-axe is changing depending on the zooming in the chart
With temperature values it’s obviously better.
baseline values of flow rate seem OK but not the maximum values.
then we tried total zoom for export data and further postprocessing.
But not the raw data were exported.Obviously the current(!) wrong display data were exported
This shouldn’t be.
cummulated curve: always chart data of current zoom window was summed up. Sorry, not useful.
default value should be: cummulative sum of all values not depending on the chart zooming
helpful enhancement: defining intervals of the curve that should be summed up. Is this possible?
Basically grafana is an interesting chart tool but getting reliable statistical results is necessary.
Thanks in advance.
Hermann
Grafana doesn’t typically export the raw underlying data from the data source - rather the CSV export feature exports “data frames” underlying what goes into visualizations and so on. Much more information here:
To get the raw data you can either query the data source directly without Grafana, or use the query inspector to see the raw results that come back from the query (albeit in a JSON format produced by the data source plugin)
Being able to export data in a convenient way is very important. It is really frustrating when you with Grafana find the data you are interested in, you try to export it according to the blog post linked above, and later you find out that much data is missing in the CSV file.
As I understand:
Only a fraction of the data is actually exported, if the setting “Max data points” for the query is insufficient
There can be a limit, how high “Max data points” can be set (for example, if I set it higher than 30000, “VictoriaMetrics datasource for Grafana” does not seem to work)
If the only solution is to query the data source directly without Grafana, one of our clients might even stop using Grafana.
(Could a related problem, which I think I have seen someone else writing about, be that sometimes short spikes in the data might not shown on dashboards, because perhaps only every tenth value is actually shown?)
Is there any working solution or planned solution in Grafana for this?
I would solve this by linking to the export API of the data source in Grafana using actions if it is from a dashboard. For Prometheus results you would link to /api/1/v1/query or /api/v1/query_range if it is for Victoriametrics specifically there is an export api for raw samples or the Victoriametrics datasource can open the query in vmui where the results can be downloaded
Thank you for the reply, mathias18. I have done some tests with the export API of VictoriaMetrics. It is possible to export data in CSV format with the export API, but difficult to figure out how to get the desired format, for example with timestamps in the desired time zone, etc.
Also, Grafana can use several different data sources, but to teach users a different way to export data for each data source would be really inconvenient.
To do export from inside Grafana would be much more user friendly. And it already works, as described in the blog post, if the time range is not too long and “Max data points” is not too low. For example: If you in Grafana export one year of data but then only get every sixth value in the CSV file, it is possible to in Grafana export about two months of data at the time and that way get all data.
Hope there can be an interest to improve this in Grafana, when Grafana is so close.
Great news! For those of us who use VictoriaMetrics with Grafana, there is now an alternative way to export data from inside Grafana and overcome the “Max data points” limitation: I have recently tried the VictoriaMetrics datasource plugin, version 0.25.0. When editing a panel using that data source, you can use the “Export data” button shown below.
It can be used to export in JSON or CSV format. Just be aware that this CSV format is not exactly the same as with Grafana’s built-in solution (using Inspect Data).