Error creating variable for dashboard after upgrade

Good afternoon!

I upgraded to the latest version of grafana today and apparently broke some dashboards.

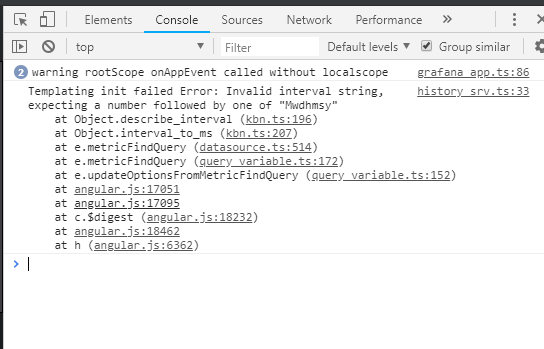
Whenever i try to load a dashboard with a variable i get the error
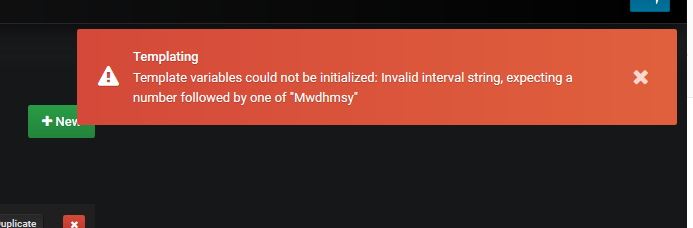
"Templating

Template variables could not be initialized: Invalid interval string, expecting a number followed by one of “Mwdhmsy”"

– EDIT –

The variable settings looks like this.

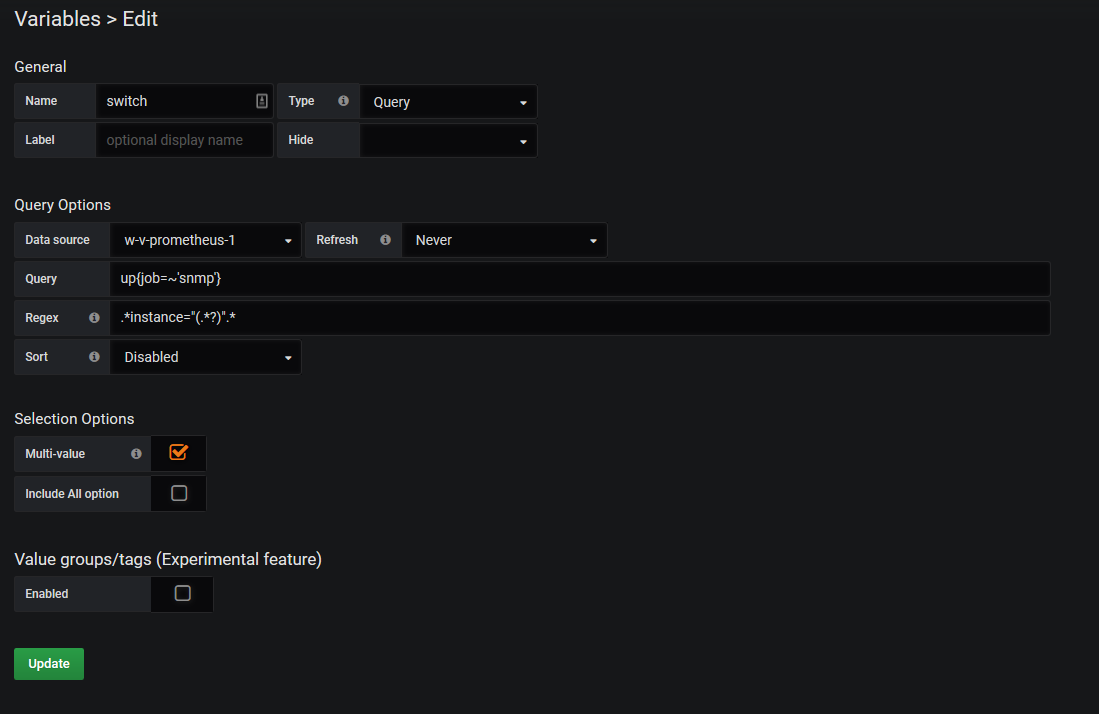
Any ideas of how to resolve this?

Best regards
Henrik

Downgraded back to previously installed version (5.2.1-1) and it works again.

All ideas to get this working on latest release are welcome.

Hey. What version was that? We just released v5.3.2.

The one that broke the variables was 5.3.2, installed today.

Cannot reproduce based on the screenshot you’ve shared. Could you please use chrome developer tools can check console for any errors plus if possible include your dashboard json model that is failing. Thanks

Console:

Capture2

JSON:

{
“annotations”: {
“list”: [
{
“builtIn”: 1,
“datasource”: “-- Grafana --”,
“enable”: true,
“hide”: true,
“iconColor”: “rgba(0, 211, 255, 1)”,
“name”: “Annotations & Alerts”,
“type”: “dashboard”
}
]
},
“editable”: true,
“gnetId”: null,
“graphTooltip”: 0,
“id”: 7,
“iteration”: 1540394453971,
“links”: ,
“panels”: [
{
“gridPos”: {
“h”: 1,
“w”: 24,
“x”: 0,
“y”: 0
},
“id”: 16,
“title”: “Row title”,
“type”: “row”
},
{
“aliasColors”: {},
“bars”: false,
“dashLength”: 10,
“dashes”: false,
“datasource”: “w-v-prometheus-1”,
“fill”: 1,
“gridPos”: {
“h”: 9,
“w”: 12,
“x”: 0,
“y”: 1
},
“id”: 12,
“interval”: “1s”,
“legend”: {
“avg”: false,
“current”: false,
“max”: false,
“min”: false,
“show”: true,
“total”: false,
“values”: false
},
“lines”: true,
“linewidth”: 1,
“links”: ,
“nullPointMode”: “null”,
“percentage”: false,
“pointradius”: 5,
“points”: false,
“renderer”: “flot”,
“seriesOverrides”: ,
“spaceLength”: 10,
“stack”: false,
“steppedLine”: false,
“targets”: [
{
“expr”: “jnxOperating1MinLoadAvg{instance=~"$switch",jnxOperatingContentsIndex="9",jnxOperatingL1Index="1",jnxOperatingL2Index="0",jnxOperatingL3Index="0",job=~"snmp"}”,
“format”: “time_series”,
“interval”: “1s”,
“intervalFactor”: 1,
“legendFormat”: “1min Load Avg”,
“refId”: “C”
},
{
“expr”: “jnxOperating5MinLoadAvg{instance=~"$switch",jnxOperatingContentsIndex="9",jnxOperatingL1Index="1",jnxOperatingL2Index="0",jnxOperatingL3Index="0",job=~"snmp"}”,
“format”: “time_series”,
“interval”: “1s”,
“intervalFactor”: 1,
“legendFormat”: “5min Load Avg”,
“refId”: “A”
},
{
“expr”: “jnxOperating15MinLoadAvg{instance=~"$switch",jnxOperatingContentsIndex="9",jnxOperatingL1Index="1",jnxOperatingL2Index="0",jnxOperatingL3Index="0",job=~"snmp"}”,
“format”: “time_series”,
“interval”: “1s”,
“intervalFactor”: 1,
“legendFormat”: “15min Load Avg”,
“refId”: “B”
}
],
“thresholds”: ,
“timeFrom”: null,
“timeShift”: null,
“title”: “$switch CPU Usage”,
“tooltip”: {
“shared”: true,
“sort”: 0,
“value_type”: “individual”
},
“type”: “graph”,
“xaxis”: {
“buckets”: null,
“mode”: “time”,
“name”: null,
“show”: true,
“values”:
},
“yaxes”: [
{
“format”: “percent”,
“label”: null,
“logBase”: 1,
“max”: null,
“min”: null,
“show”: true
},
{
“format”: “short”,
“label”: null,
“logBase”: 1,
“max”: null,
“min”: null,
“show”: true
}
],
“yaxis”: {
“align”: false,
“alignLevel”: null
}
},
{
“cacheTimeout”: null,
“colorBackground”: false,
“colorValue”: false,
“colors”: [
#299c46”,
“rgba(237, 129, 40, 0.89)”,
#d44a3a
],
“datasource”: “w-v-prometheus-1”,
“format”: “timeticks”,
“gauge”: {
“maxValue”: 100,
“minValue”: 0,
“show”: false,
“thresholdLabels”: false,
“thresholdMarkers”: true
},
“gridPos”: {
“h”: 9,
“w”: 12,
“x”: 12,
“y”: 1
},
“id”: 14,
“interval”: “1s”,
“links”: ,
“mappingType”: 1,
“mappingTypes”: [
{
“name”: “value to text”,
“value”: 1
},
{
“name”: “range to text”,
“value”: 2
}
],
“maxDataPoints”: 100,
“nullPointMode”: “connected”,
“nullText”: null,
“postfix”: “”,
“postfixFontSize”: “50%”,
“prefix”: “”,
“prefixFontSize”: “50%”,
“rangeMaps”: [
{
“from”: “null”,
“text”: “N/A”,
“to”: “null”
}
],
“sparkline”: {
“fillColor”: “rgba(31, 118, 189, 0.18)”,
“full”: false,
“lineColor”: “rgb(31, 120, 193)”,
“show”: false
},
“tableColumn”: “”,
“targets”: [
{
“expr”: “jnxOperatingUpTime{instance=~"$switch",jnxOperatingContentsIndex="1",jnxOperatingL1Index="1",jnxOperatingL2Index="0",jnxOperatingL3Index="0",job=~"snmp"}”,
“format”: “time_series”,
“interval”: “”,
“intervalFactor”: 1,
“legendFormat”: “$switch Uptime”,
“refId”: “A”
}
],
“thresholds”: “”,
“title”: “$switch Uptime”,
“type”: “singlestat”,
“valueFontSize”: “80%”,
“valueMaps”: [
{
“op”: “=”,
“text”: “N/A”,
“value”: “null”
}
],
“valueName”: “avg”
},
{
“gridPos”: {
“h”: 1,
“w”: 24,
“x”: 0,
“y”: 10
},
“id”: 10,
“title”: “Row title”,
“type”: “row”
},
{
“aliasColors”: {},
“bars”: false,
“dashLength”: 10,
“dashes”: false,
“datasource”: “w-v-prometheus-1”,
“fill”: 1,
“gridPos”: {
“h”: 9,
“w”: 12,
“x”: 0,
“y”: 11
},
“id”: 2,
“interval”: “10s”,
“legend”: {
“avg”: false,
“current”: true,
“hideEmpty”: false,
“hideZero”: false,
“max”: true,
“min”: true,
“show”: true,
“total”: false,
“values”: true
},
“lines”: true,
“linewidth”: 1,
“links”: ,
“nullPointMode”: “null”,
“percentage”: false,
“pointradius”: 5,
“points”: false,
“renderer”: “flot”,
“seriesOverrides”: ,
“spaceLength”: 10,
“stack”: false,
“steppedLine”: false,
“targets”: [
{
“expr”: "jnxOperatingTemp{instance=~"$switch",jnxOperatingContentsIndex=~"7",jnxOperatingL1Index=~"1",jnxOperatingL2Index=~"0",jnxOperatingL3Index=~"0",job=~"snmp"} ",
“format”: “time_series”,
“hide”: false,
“instant”: false,
“interval”: “10s”,
“intervalFactor”: 1,
“legendFormat”: “$switch Temp1”,
“refId”: “A”
},
{
“expr”: "jnxOperatingTemp{instance=~"$switch",jnxOperatingContentsIndex=~"7",jnxOperatingL1Index=~"1",jnxOperatingL2Index=~"0",jnxOperatingL3Index=~"0",job=~"snmp"} ",
“format”: “time_series”,
“interval”: “10s”,
“intervalFactor”: 1,
“legendFormat”: “$switch Temp2”,
“refId”: “B”
}
],
“thresholds”: ,
“timeFrom”: null,
“timeShift”: null,
“title”: “Temperatures”,
“tooltip”: {
“shared”: true,
“sort”: 0,
“value_type”: “individual”
},
“type”: “graph”,
“xaxis”: {
“buckets”: null,
“mode”: “time”,
“name”: null,
“show”: true,
“values”:
},
“yaxes”: [
{
“format”: “celsius”,
“label”: null,
“logBase”: 1,
“max”: null,
“min”: null,
“show”: true
},
{
“format”: “short”,
“label”: null,
“logBase”: 1,
“max”: null,
“min”: null,
“show”: true
}
],
“yaxis”: {
“align”: false,
“alignLevel”: null
}
},
{
“cacheTimeout”: null,
“colorBackground”: true,
“colorValue”: false,
“colors”: [
#299c46”,
“rgba(237, 129, 40, 0.89)”,
#d44a3a
],
“datasource”: “w-v-prometheus-1”,
“decimals”: 0,
“format”: “celsius”,
“gauge”: {
“maxValue”: 100,
“minValue”: 0,
“show”: false,
“thresholdLabels”: false,
“thresholdMarkers”: true
},
“gridPos”: {
“h”: 9,
“w”: 12,
“x”: 12,
“y”: 11
},
“id”: 4,
“interval”: “1s”,
“links”: ,
“mappingType”: 1,
“mappingTypes”: [
{
“name”: “value to text”,
“value”: 1
},
{
“name”: “range to text”,
“value”: 2
}
],
“maxDataPoints”: 100,
“nullPointMode”: “connected”,
“nullText”: null,
“postfix”: “”,
“postfixFontSize”: “50%”,
“prefix”: “”,
“prefixFontSize”: “50%”,
“rangeMaps”: [
{
“from”: “null”,
“text”: “N/A”,
“to”: “null”
}
],
“sparkline”: {
“fillColor”: “rgba(31, 118, 189, 0.18)”,
“full”: false,
“lineColor”: “rgb(31, 120, 193)”,
“show”: false
},
“tableColumn”: “”,
“targets”: [
{
“expr”: "jnxOperatingTemp{instance=~"$switch",jnxOperatingContentsIndex=~"7",jnxOperatingL1Index=~"1",jnxOperatingL2Index=~"0",jnxOperatingL3Index=~"0",job=~"snmp"} ",
“format”: “time_series”,
“interval”: “”,
“intervalFactor”: 1,
“legendFormat”: “$switch Temp”,
“refId”: “A”
}
],
“thresholds”: “50,60”,
“title”: “$switch Temp”,
“type”: “singlestat”,
“valueFontSize”: “80%”,
“valueMaps”: [
{
“op”: “=”,
“text”: “N/A”,
“value”: “null”
}
],
“valueName”: “current”
},
{
“columns”: ,
“datasource”: “w-v-prometheus-1”,
“fontSize”: “100%”,
“gridPos”: {
“h”: 16,
“w”: 24,
“x”: 0,
“y”: 20
},
“id”: 8,
“interval”: “1s”,
“links”: ,
“pageSize”: null,
“scroll”: true,
“showHeader”: true,
“sort”: {
“col”: 0,
“desc”: true
},
“styles”: [
{
“alias”: “”,
“colorMode”: null,
“colors”: [
“rgba(245, 54, 54, 0.9)”,
“rgba(237, 129, 40, 0.89)”,
“rgba(50, 172, 45, 0.97)”
],
“dateFormat”: “YYYY-MM-DD HH:mm:ss”,
“decimals”: 2,
“mappingType”: 1,
“pattern”: “name”,
“thresholds”: ,
“type”: “hidden”,
“unit”: “short”
},
{
“alias”: “”,
“colorMode”: null,
“colors”: [
“rgba(245, 54, 54, 0.9)”,
“rgba(237, 129, 40, 0.89)”,
“rgba(50, 172, 45, 0.97)”
],
“dateFormat”: “YYYY-MM-DD HH:mm:ss”,
“decimals”: 2,
“mappingType”: 1,
“pattern”: “instance”,
“thresholds”: ,
“type”: “hidden”,
“unit”: “short”
},
{
“alias”: “”,
“colorMode”: null,
“colors”: [
“rgba(245, 54, 54, 0.9)”,
“rgba(237, 129, 40, 0.89)”,
“rgba(50, 172, 45, 0.97)”
],
“dateFormat”: “YYYY-MM-DD HH:mm:ss”,
“decimals”: 2,
“mappingType”: 1,
“pattern”: “job”,
“thresholds”: ,
“type”: “hidden”,
“unit”: “short”
},
{
“alias”: “”,
“colorMode”: null,
“colors”: [
“rgba(245, 54, 54, 0.9)”,
“rgba(237, 129, 40, 0.89)”,
“rgba(50, 172, 45, 0.97)”
],
“dateFormat”: “YYYY-MM-DD HH:mm:ss”,
“decimals”: 2,
“mappingType”: 1,
“pattern”: “Time”,
“thresholds”: ,
“type”: “hidden”,
“unit”: “short”
},
{
“alias”: “”,
“colorMode”: null,
“colors”: [
“rgba(245, 54, 54, 0.9)”,
“rgba(237, 129, 40, 0.89)”,
“rgba(50, 172, 45, 0.97)”
],
“decimals”: 0,
“pattern”: “/./",
“thresholds”: [],
“type”: “number”,
“unit”: “short”
}
],
“targets”: [
{
“expr”: “jnxOperatingDescr{instance=~"$switch",job=~"snmp"}”,
“format”: “table”,
“interval”: “1s”,
“intervalFactor”: 1,
“legendFormat”: “”,
“refId”: “A”
}
],
“timeFrom”: “1s”,
“timeShift”: null,
“title”: “$switch Operating Description”,
“transform”: “table”,
“type”: “table”
},
{
“collapsed”: false,
“gridPos”: {
“h”: 1,
“w”: 24,
“x”: 0,
“y”: 36
},
“id”: 6,
“panels”: [],
“title”: “Row title”,
“type”: “row”
},
{
“columns”: [],
“datasource”: “w-v-prometheus-1”,
“fontSize”: “100%”,
“gridPos”: {
“h”: 61,
“w”: 24,
“x”: 0,
“y”: 37
},
“hideTimeOverride”: false,
“id”: 18,
“interval”: “1s”,
“links”: [],
“pageSize”: 25,
“scroll”: true,
“showHeader”: true,
“sort”: {
“col”: 0,
“desc”: true
},
“styles”: [
{
“alias”: “Time”,
“dateFormat”: “YYYY-MM-DD HH:mm:ss”,
“pattern”: “Time”,
“type”: “hidden”
},
{
“alias”: “”,
“colorMode”: null,
“colors”: [
“rgba(245, 54, 54, 0.9)”,
“rgba(237, 129, 40, 0.89)”,
“rgba(50, 172, 45, 0.97)”
],
“dateFormat”: “YYYY-MM-DD HH:mm:ss”,
“decimals”: 2,
“mappingType”: 1,
“pattern”: “jnxVlanMacAddress”,
“sanitize”: true,
“thresholds”: [],
“type”: “string”,
“unit”: “short”
},
{
“alias”: “”,
“colorMode”: null,
“colors”: [
“rgba(245, 54, 54, 0.9)”,
“rgba(237, 129, 40, 0.89)”,
“rgba(50, 172, 45, 0.97)”
],
“dateFormat”: “YYYY-MM-DD HH:mm:ss”,
“decimals”: 2,
“mappingType”: 1,
“pattern”: “instance”,
“thresholds”: [],
“type”: “hidden”,
“unit”: “short”
},
{
“alias”: “”,
“colorMode”: null,
“colors”: [
“rgba(245, 54, 54, 0.9)”,
“rgba(237, 129, 40, 0.89)”,
“rgba(50, 172, 45, 0.97)”
],
“dateFormat”: “YYYY-MM-DD HH:mm:ss”,
“decimals”: 2,
“mappingType”: 1,
“pattern”: “name”,
“thresholds”: [],
“type”: “hidden”,
“unit”: “short”
},
{
“alias”: “”,
“colorMode”: null,
“colors”: [
“rgba(245, 54, 54, 0.9)”,
“rgba(237, 129, 40, 0.89)”,
“rgba(50, 172, 45, 0.97)”
],
“dateFormat”: “YYYY-MM-DD HH:mm:ss”,
“decimals”: 2,
“mappingType”: 1,
“pattern”: “job”,
“thresholds”: [],
“type”: “hidden”,
“unit”: “short”
},
{
“alias”: “”,
“colorMode”: null,
“colors”: [
“rgba(245, 54, 54, 0.9)”,
“rgba(237, 129, 40, 0.89)”,
“rgba(50, 172, 45, 0.97)”
],
“dateFormat”: “YYYY-MM-DD HH:mm:ss”,
“decimals”: 2,
“mappingType”: 1,
“pattern”: “Value”,
“thresholds”: [],
“type”: “hidden”,
“unit”: “short”
},
{
“alias”: “”,
“colorMode”: null,
“colors”: [
“rgba(245, 54, 54, 0.9)”,
“rgba(237, 129, 40, 0.89)”,
“rgba(50, 172, 45, 0.97)”
],
“decimals”: 2,
“pattern”: "/.
/”,
“thresholds”: ,
“type”: “number”,
“unit”: “short”
}
],
“targets”: [
{
“expr”: “jnxVlanMacAddress{instance=~"$switch",job=~"snmp"}”,
“format”: “table”,
“instant”: true,
“interval”: “1s”,
“intervalFactor”: 1,
“legendFormat”: “”,
“refId”: “A”
}
],
“timeFrom”: “1s”,
“timeShift”: null,
“title”: “Connected Mac-addresses $switch”,
“transform”: “table”,
“type”: “table”
}
],
“refresh”: “15m”,
“schemaVersion”: 16,
“style”: “dark”,
“tags”: ,
“templating”: {
“list”: [
{
“allValue”: null,
“current”: {
“isNone”: true,
“text”: “None”,
“value”: “”
},
“datasource”: “w-v-prometheus-1”,
“hide”: 0,
“includeAll”: false,
“label”: null,
“multi”: false,
“name”: “switch”,
“options”: ,
“query”: “up{job=~‘snmp’}”,
“refresh”: 1,
“regex”: “.instance="(.?)".*”,
“skipUrlSync”: false,
“sort”: 0,
“tagValuesQuery”: “”,
“tags”: ,
“tagsQuery”: “”,
“type”: “query”,
“useTags”: false
}
]
},
“time”: {
“from”: “now-6h”,
“to”: “now”
},
“timepicker”: {
“refresh_intervals”: [
“5s”,
“10s”,
“30s”,
“1m”,
“5m”,
“15m”,
“30m”,
“1h”,
“2h”,
“1d”
],
“time_options”: [
“5m”,
“15m”,
“1h”,
“6h”,
“12h”,
“24h”,
“2d”,
“7d”,
“30d”
]
},
“timezone”: “”,
“title”: “Switch status overview”,
“uid”: “AEsabbxmk”,
“version”: 20
}

Thanks. Still unable to replicate. Can you please share the full url in your browser when you receive this error. Thanks

http://w-v-grafana-0:3000/d/AEsabbxmk/switch-status-overview?editview=templating&refresh=15m&orgId=1&var-switch=w-d110005-a-7

tried on a new dashboard as well

http://w-v-grafanaclone-0:3000/dashboard/new?editview=templating&orgId=1&panelId=&fullscreen=&edit=

That’s the full url, going to try exporting the dashboard to another test-server and to see if i can replicate this.

Thanks

EDIT:

The query looks like this:

jnxOperating15MinLoadAvg{instance=~"$switch",jnxOperatingContentsIndex=“9”,jnxOperatingL1Index=“1”,jnxOperatingL2Index=“0”,jnxOperatingL3Index=“0”,job=~“snmp”}

I cannot access the links you’ve included. Based on your last post which you withdraw - did you resolve the problem?

If not, the query you’ve included is that what causing your problem? In general, I would recommend that you open a bug report on Grafana github repository if your problem isn’t resolved .

I actually ended up installing a fresh grafana on a new server with all the same settings which ended up working just fine. No idea as to why i got that error but it’s solved now anyhow.

Thank you for the help!

1 Like

Hello,
I got same issue.
Please refer: https://community.grafana.com/t/grafana-with-influxdb-issues-with-choosing-fields-for-graph/6333/2?u=thachnv92
This is solution:
Go to Data Source config => change “Min time interval” to great than 60s

Good luck ^^