Is it possible to display two visualizations in the same panel? I have two things I want to graph, my temperature sensors and my heater state. I’ve found the discrete panel plugin to be perfect for the heater state and the graph is fine for the temperatures. But I can only figure out how to put them in two different panels and the time axis don’t really line up correctly. Is there a way to overlay them?
Unfortunately I believe not, although I think this would be a good feature to
add.
Antony.
Not trying to necro this thread, but I’m googling all the terms I can think if to figure out how to do this after I saw a timeseries and gauge combined on Grafana’s official documentation. If anyone knows how to do this, please show me how!
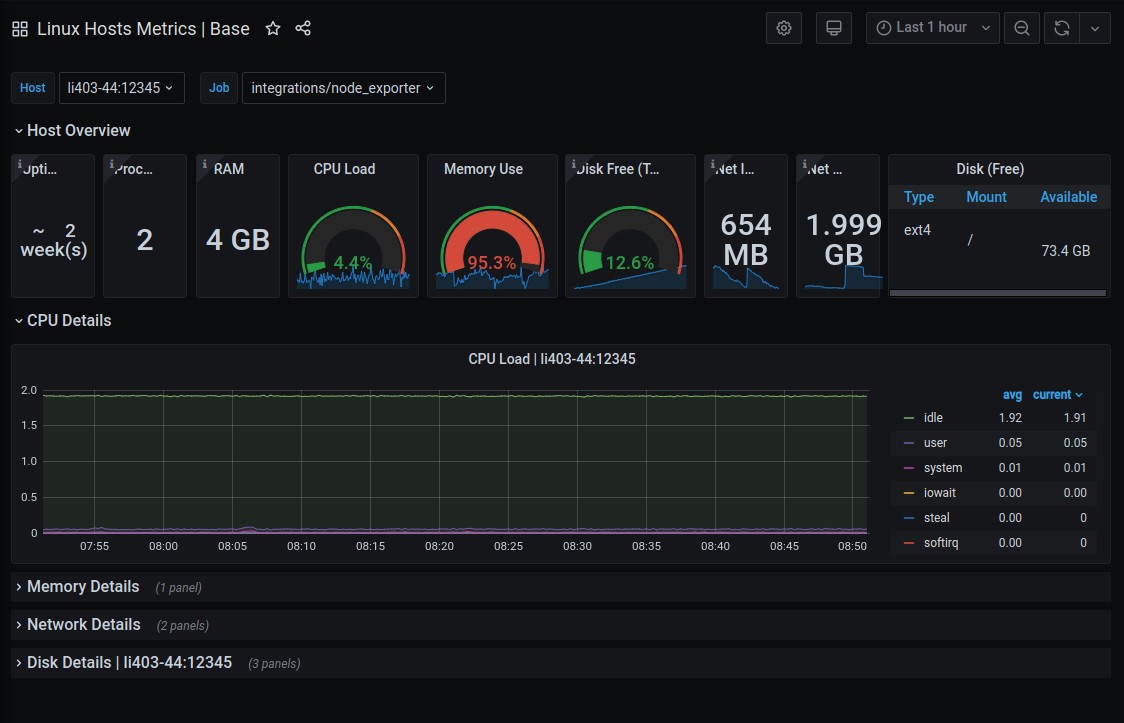
source: Monitoring a Linux host using Prometheus and node_exporter | Grafana Labs
In this guide, they reference dashboard 10180. I have imported this dashboard, but it doesn’t have the same dual visualization as shown in the example, and for some reason, I cannot edit the properties. I tried cloning the JSON over to a new dashboard, and I’m now able to edit the visualization but I am still not getting the desired effect.
@andysks I saw noticed your comment about dashboard 10180. The sparkline existed in the gauge panel before 8.0. The stat panel still has a sparkline.
Now, you can use the special datasource - -dashboard- - in a panel to share query results between multiple panels.
Thanks, this looks like good information. I’m in the middle of transitioning to a self-hosted Grafana cluster so I can’t test right now but I’ve added this as an item on my to-do.