I have an ubuntu computer running influxdb and grafana. Grafana v12.1.0 Influxdb v2.7.11. It is taking weather data from a few pi zeros (with bme280 sensors). I had a few strange readings when the bme280 first started up. I deleted the data in influxdb for a narrow time range when the readings were taken. I have queried influxdb and the data is gone. However the strange data readings are still appearing in the grafana graphs. How do I get rid of the readings in grafana.
I am new to all this and doing this project to learn. Any help or insight would be appreciated.
Hello @ssames ,
After analyzing the issue, I believe I have identified the underlying problem. Please find below the recommended steps that may help resolve it
This is almost certainly due to Grafana caching or the browser caching the panel images, or InfluxDB returning old data
Step 1. Confirm InfluxDB really isn’t returning the old values
Step 2. Refresh the Grafana panel (and clear panel cache)
Step 3. Check Grafana’s query and panel configuration
Step 4. Restart Grafana
I will try this, thank you.
1 Like
Hello @ssames
Just checking in—did this solution resolve your issue, or are you still experiencing the same problem?
The problem still persists.
“This is almost certainly due to Grafana caching or the browser caching the panel images, or InfluxDB returning old data
Step 1. Confirm InfluxDB really isn’t returning the old values”
This morning I focused on an area of data that had strange results due to the first readings on the bme280 sensors. I ran this in the terminal and could see lots of data.
influx query --org ‘homelab’ --raw ‘from(bucket: “weather_data”) |> range(start: 2025-08-06T10:00:00Z, stop: 2025-08-06T11:00:00Z)’
Then this:
influx delete --bucket ‘weather_data’ --org ‘homelab’ --start 2025-08-06T10:00:00Z --stop 2025-08-06T11:00:00Z
Then the query returned no data.
The grafana still shows a graph of data in this time range after hitting the grafana refresh button.
“Step 2. Refresh the Grafana panel (and clear panel cache)”
I tried this and also inspect - query - refresh for the panel.
The graph still showed the data.
Also, a web browser refresh did not work.
“Step 3. Check Grafana’s query and panel configuration”
This was all correct and as it should be,
“Step 4. Restart Grafana”
I tried this and I even rebooted the server and the graph still showed all the data.
I think I will give up on this. It is frustrating. I have only a couple of days data so I have gone for a rather inelegant solution. I have just decided to alter the code on my three weather monitors to ignore the bme280’s first readings, then record all the data as “label_v2” instead of “label”. Then alter my panels and start again.
Thank you for your suggestions, I am a beginner with this and have learnt a bit more and gained some more confidence trying to fix this problem.
Does the data appear in Influx Data Explorer? (https://your-server-ip-address:8086)
Just checked this now. Yes it does show in the influx data explorer!
The above initial statement therefore contradicts what you are seeing in Influx Data Explorer. Grafana is simply displaying what is in Influx.
It is not a straightforward exercise to delete data from InfluxDB. How did you do it?
I used an ssh terminal to the server and did a query which showed the data then deleted it with:
influx delete --bucket ‘weather_data’ --org ‘homelab’ --start 2025-08-06T10:00:00Z --stop 2025-08-06T11:00:00Z
Then queried again (in the terminal) which did not show any data.
What was your query in the SSH terminal window? I always use Influx Data Explorer to write / test queries, so am unfamiliar with how this is done via terminal.
influx query --org ‘homelab’ --raw ‘from(bucket: “weather_data”) |> range(start: 2025-08-06T10:00:00Z, stop: 2025-08-06T11:00:00Z)’
Can you put this same query into Influx Data Explorer and see what it returns?
from(bucket: "weather_data")
  |> range(start: 2025-08-06T10:00:00Z, stop: 2025-08-06T11:00:00Z)

The command in data explorer returns no results:

However, selecting the options as a query shows data:
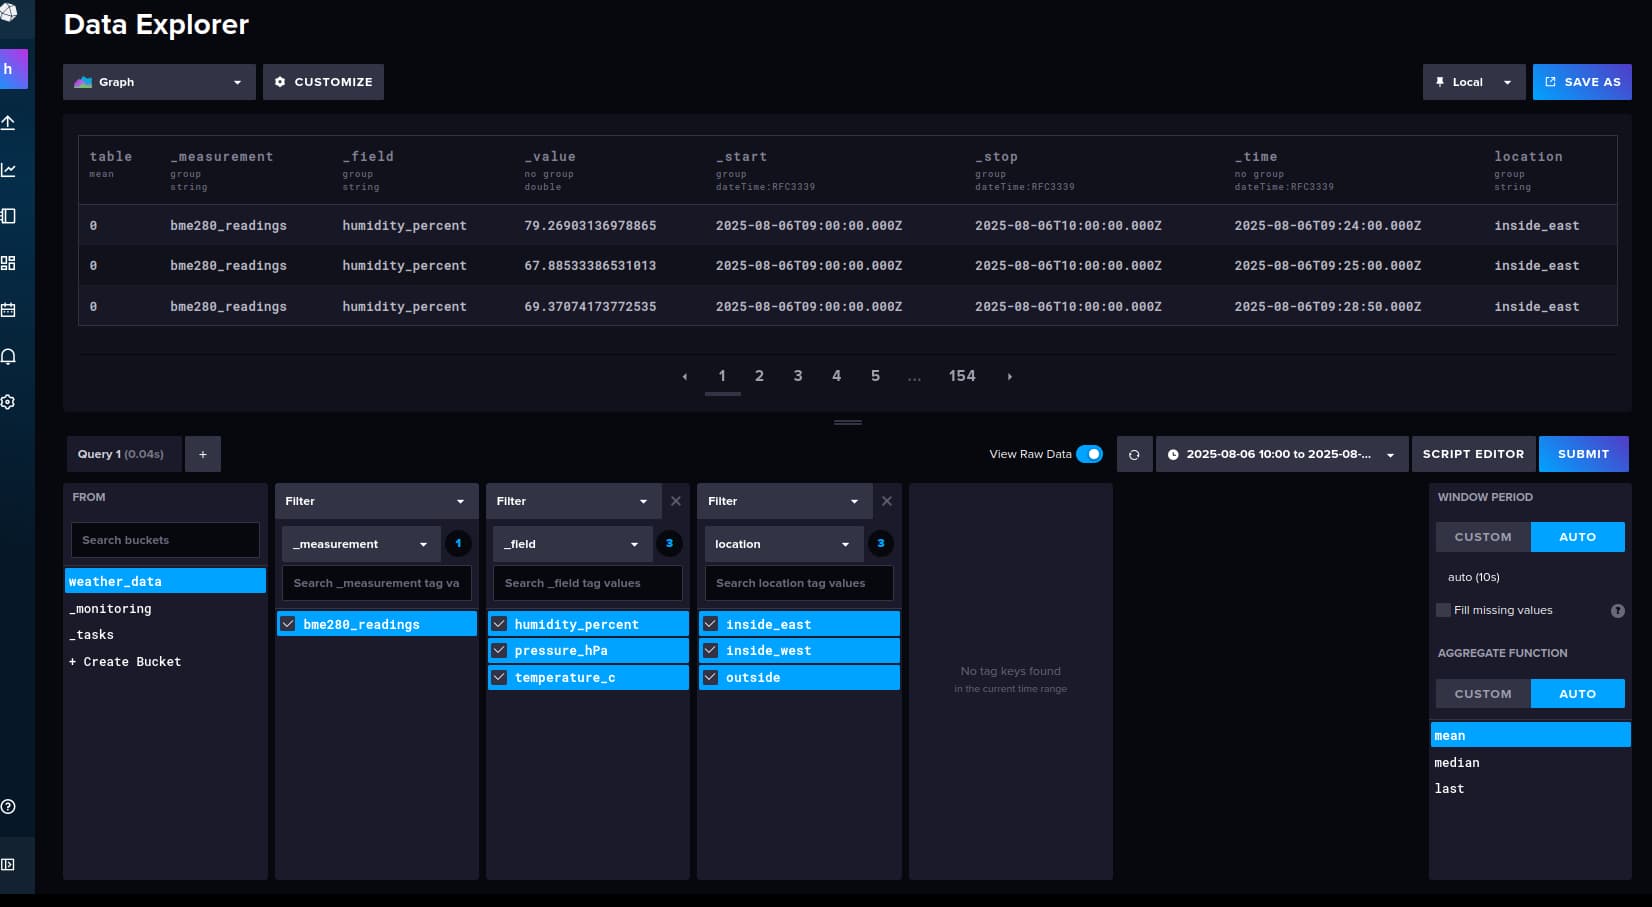
I think your delete command did not really delete everything. The instructions are not really detailed. Maybe add the predicate line for measurement and/or tags?
influx delete --bucket example-bucket
–start '1970-01-01T00:00:00Z'
–stop $(date -u +"%Y-%m-%dT%H:%M:%SZ")
–predicate '_measurement="example-measurement" AND exampleTag="exampleTagValue"'
I just ran these three in the ssh terminal:
influx delete --bucket weather_data
–start ‘2025-08-06T10:00:00Z’
–stop ‘2025-08-06T11:00:00Z’
–predicate ‘_measurement=“bme280_readings” AND location=“inside_east”’
influx delete --bucket weather_data
–start ‘2025-08-06T10:00:00Z’
–stop ‘2025-08-06T11:00:00Z’
–predicate ‘_measurement=“bme280_readings” AND location=“inside_west”’
influx delete --bucket weather_data
–start ‘2025-08-06T10:00:00Z’
–stop ‘2025-08-06T11:00:00Z’
–predicate ‘_measurement=“bme280_readings” AND location=“outside”’
However, a new query in the influx explorer still shows the data.
Like I said earlier, deleting data from InfluxDB is not really straightforward or very intuitive (at least to me). This is not a Grafana issue, so I would suggest you post all this on the InfluxDB Slack channel or their forum.
Thank you. I’ll do that.