I All
I am facing this issue in Grafana v9.0 that. In Database column I have stored only date but in grafana in table visual somehow it is adding time on its own. And in table its showing date and time which I do not want. How do I get only date
I All
I am facing this issue in Grafana v9.0 that. In Database column I have stored only date but in grafana in table visual somehow it is adding time on its own. And in table its showing date and time which I do not want. How do I get only date
Welcome
What is your final visualization for this data?
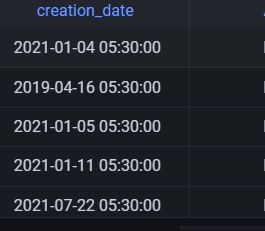
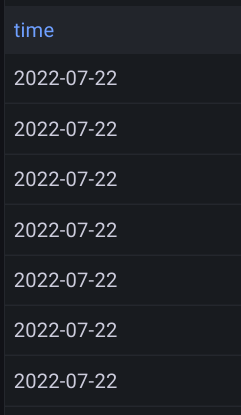
This is what I am getting.

This is what I want. I want only date
is your final visualization going to be a table visualization?
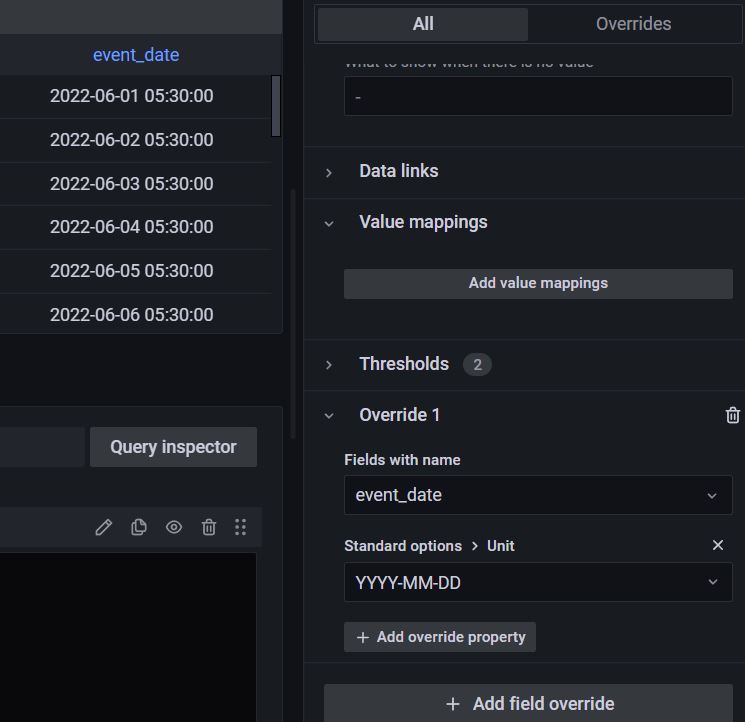
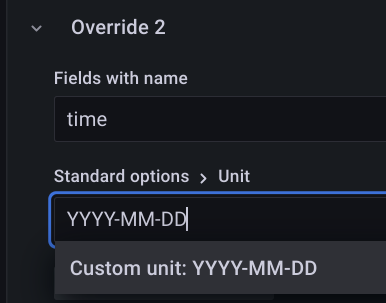
@j13ovan Welcome to the Grafana community. You can create custom units. In the override section, try something like this:
BEFORE:
AFTER:
@j13ovan It’s a bit tricky to explain in words, so I made a short video. After you create the custom unit, you have to select and click it with your mouse.

I am trying to display the same date from above computation as a single stat but it does not come, however in the table view its getting reflected properly.
Can anyone guide me?
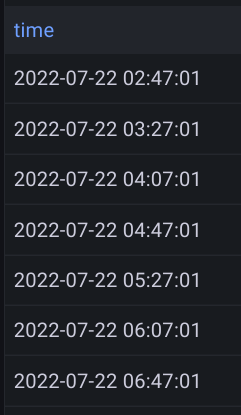
Hi, im wondering how i can do the opposite. I need only the time, as date is getting in the way when i try doing math with time. can you help?
This is really useful to me, thank you for your help!
Turns out, I needed to escape the slashes: DD\/MM\/YYYY.