Hi.
I am looking how to do a dashboard in grafana where trace duration can be seen during time and not in a table. I want to spot some sporadic latency issues, where some other views are shown in parallel, and then have the ability to click and drill down on the particular request.
I had this view in jaeger, and when I moved to opentelemetry + tempo + grafana, there is no simple way to achive this. Yet I can filter in the explore tab, I don’t get the same experience.
Something like https://developers.redhat.com/blog/wp-content/uploads/2017/07/2017-06-26-traces.png.
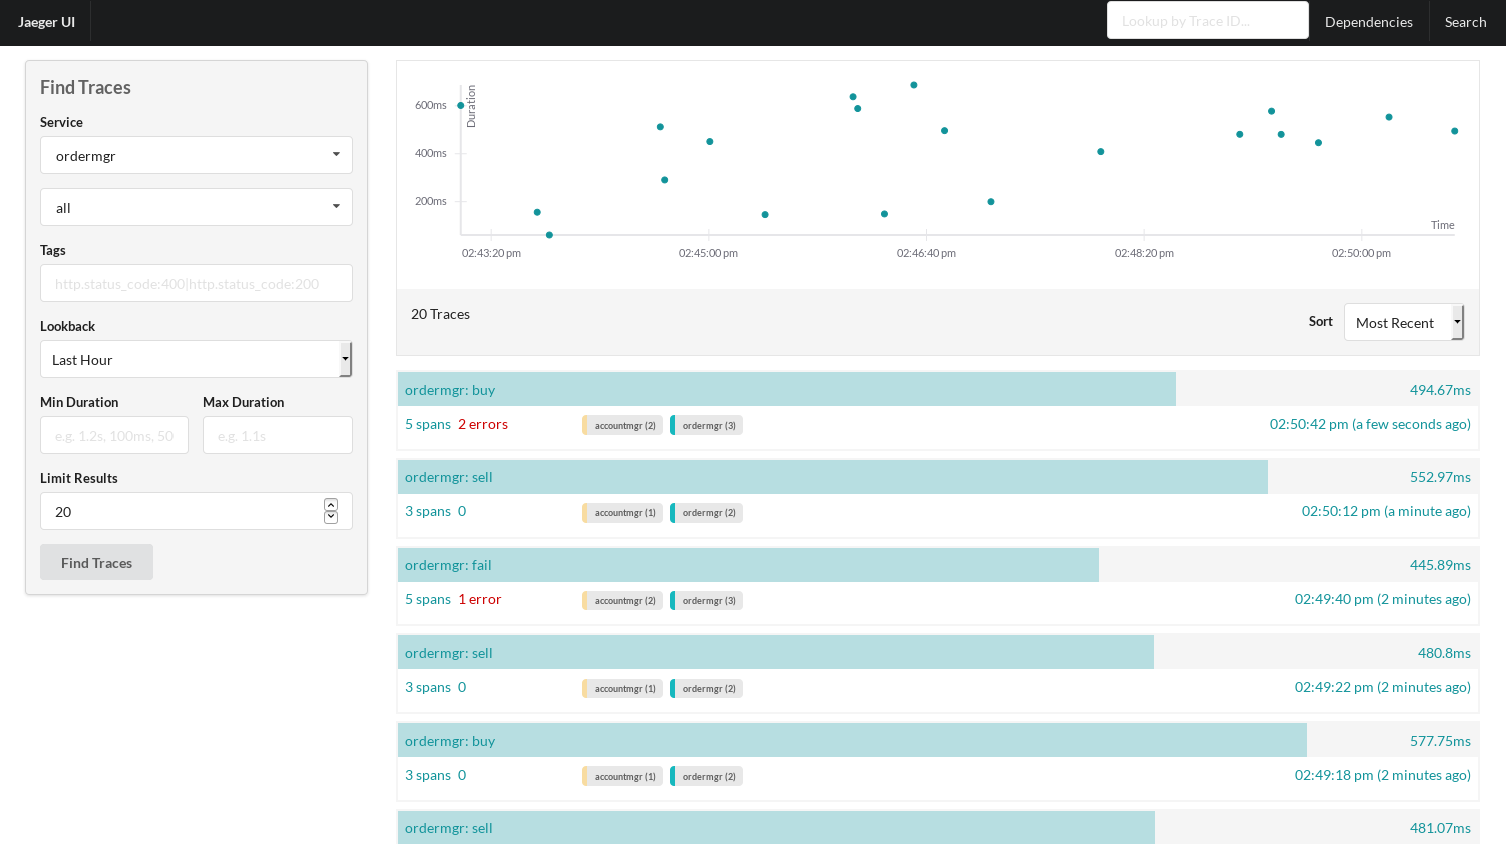
Please, advice.
Thanks.