I’m trying to create a histogram using the Graph Plugin that would display range of hours worked per day (for the last 30 days).
Very similar to this Hourly Heatmap plugin:
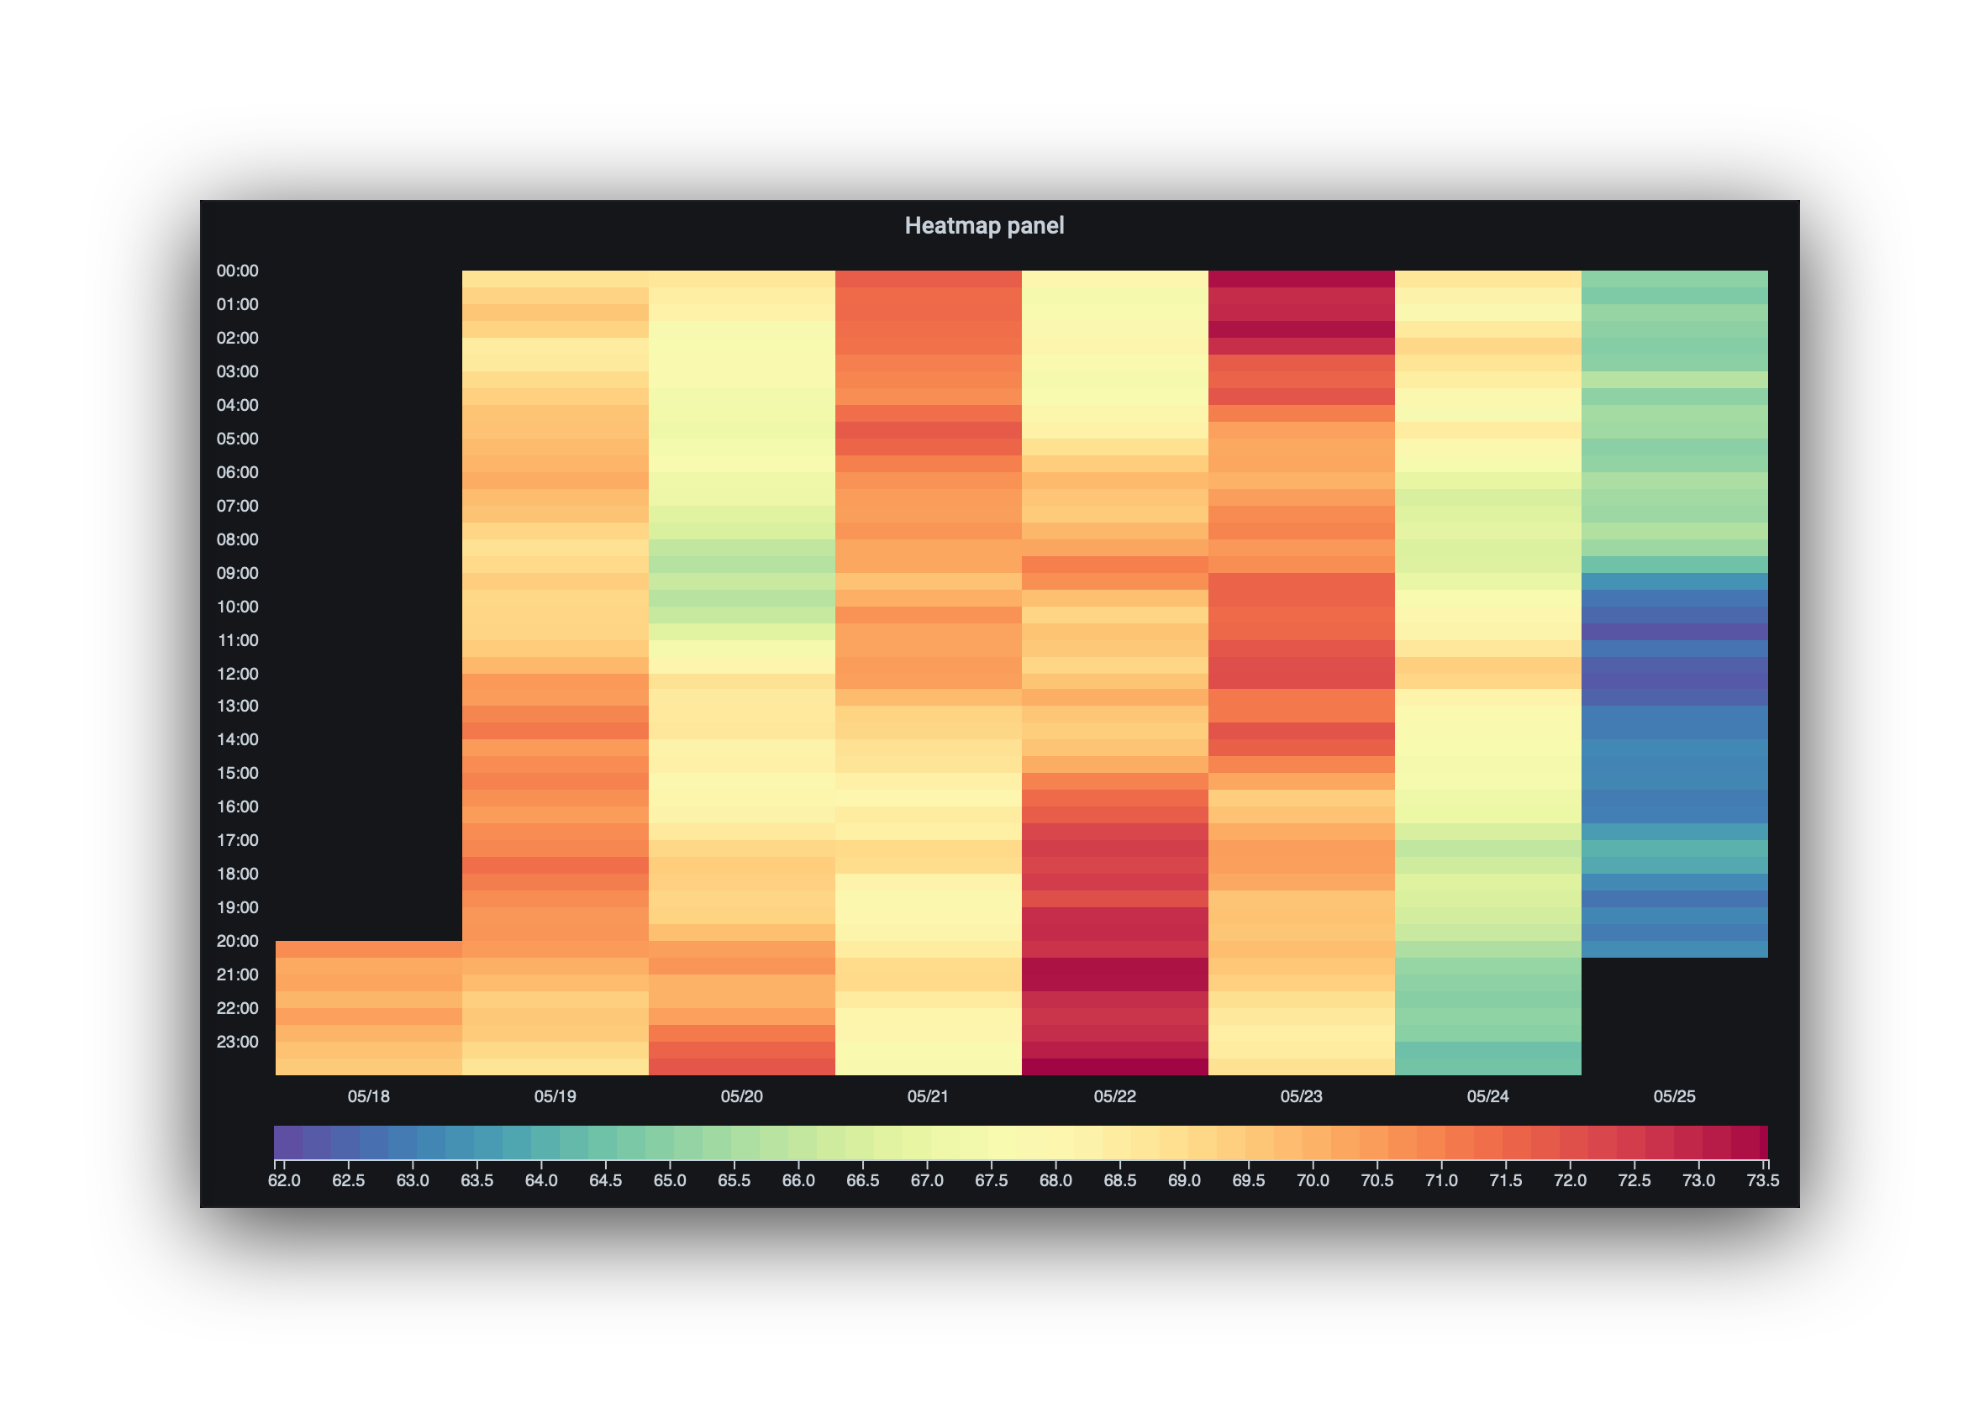
Idea is to have hours worked as Y value and date as X value like above.
The problem I have is that the values in the database are stored as Timestamp and I get an error:
Value column must have numeric datatype, column: value type: time.Time value: 0000-01-01 11:58:59 +0000 UTC
Using query:
SELECT
      first_online::date as time,
      first_online::time as value
The first_online column value looks like:
2021-03-02 11:58:59
The first_online::date looks like:
2021-03-02
The first_online::time looks like:
11:58:59
How exactly do you make Grafana accept first_online::time as a “value”