I’m currently facing an issue while configuring alert notifications from Grafana to Microsoft Teams. When I try to send a test alert, I receive the following error:
pgsql
CopyEdit
Failed to send test alert.: the receiver timed out: send notification to Teams: Post "https://groupecgi.webhook.office.com/webhookb2/…": context deadline exceeded
What I’ve Tried:
Verified that the proxy and required ports are open to allow outbound traffic to the Teams webhook URL.
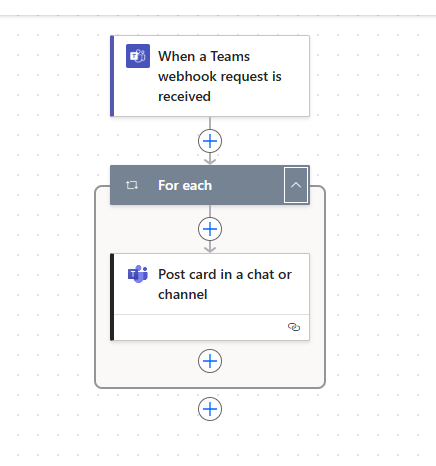
Tested using both the standard Teams Incoming Webhook and also via a custom workflow created using Microsoft Teams Power Automate — both result in the same timeout issue.
Ensured that the webhook URL is reachable from the server side (no network blocks or firewalls).
Also attempted using Azure Logic Apps and faced a similar context deadline exceeded error there as well.
Request:
Could you please help investigate if this is related to how Grafana handles webhook responses (e.g., timeout threshold, retries, etc.) or if there’s any workaround or fix we can apply on the Grafana side?
Let me know if you need logs, JSON payloads, or environment details for further debugging.
Grafana is installed on one of our Windows servers. We’ve enabled the necessary outbound ports on the server to allow external communication, as we also use it to access SharePoint and other external services.
In our environment, we typically use proxy settings to bypass organizational restrictions on certain websites. However, in this case, I’ve reached out to our security team to specifically allow outbound access to Microsoft Teams webhook URLs, so that Grafana can send alert notifications without being blocked they have done necessary things to make the url work they asked me to enable the proxy which went well. But even after they enabled the webhook url i am getting the timeout error.
We’ve now opened access to https://webhook.office.com at the security level, so the server should be able to reach the Microsoft Teams webhook URL without restrictions. This is to ensure that Grafana can successfully send alert notifications to Teams.
Regarding proxy configuration — since we are using Windows Server 2019, we’ve enabled the proxy through the server’s built-in settings:
• Proxy settings were configured via Settings > Network & Internet > Proxy, where we manually enabled and set the proxy for the server.
After setting these, I restarted the Grafana service and re-tested the Microsoft Teams alert notification. Unfortunately, I’m still receiving the same error:
Failed to send test alert.: the receiver timed out: send notification to Teams: Post “/webhook.office.com/…": context deadline exceeded
To further troubleshoot:
• The webhook URL is accessible from the server (tested via curl and Invoke-WebRequest).
• No firewall blocks or network restrictions on the mentioned ports.
• The proxy is reachable and functional for other outbound requests.
Could you please help identify if there are any Grafana-level timeout settings or known issues with Teams webhook integrations that could be contributing to this? Also, are there any specific logs or debug flags I should enable to get more insight?
[log]
# Either "console", "file", "syslog". Default is console and file
# Use space to separate multiple modes, e.g. "console file"
mode = console file

# Either "debug", "info", "warn", "error", "critical", default is "info"
level = debug
Then restart grafana for the setting to go into effect.
Following up on this I had the same contact point built and functioning i.e. Grafana alerts were being forwarded to an MS Teams channel. On Saturday 5 AM UTC, it stopped sending the alerts to the Channel. The alerts are still firing. Testing gives the same error :Context deadline exceeded Failed to send test alert.: the receiver timed out: send notification to Teams: Post . Any Inputs as to what may be causing this and how to go about trouble shooting this?