Hello Grafana Community,
I’m facing a problem creating a combined visualization in Grafana, and I’d really appreciate your help.
What I’m trying to do:
- I want to build a single panel that combines:
- A TimeSeries chart (orange panel) with lines and bars mixed.
- Two Bar charts, one aligned to the right Y-axis, and the other to the left Y-axis, below or combined in the same panel.
The problems I’m facing:
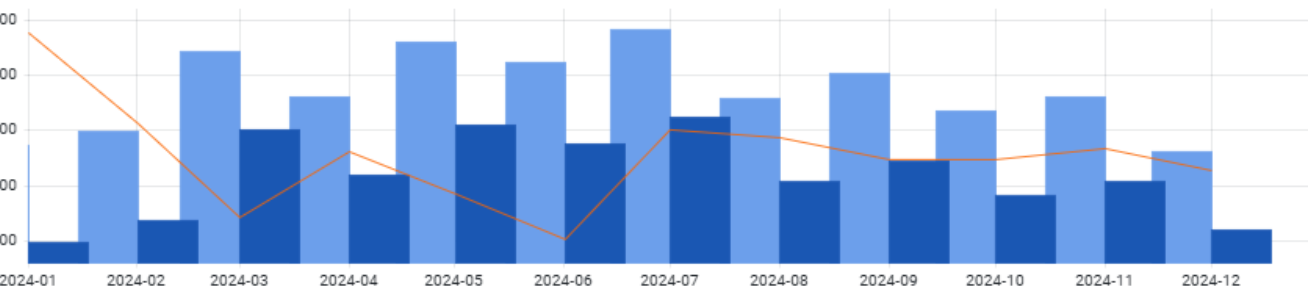
- The columns in the bar chart are overlapping, making them unreadable.
- I can’t see the first column at all.
- Ideally, I want to combine multiple TimeSeries with different graph styles (lines + bars), with the bars positioned on opposite sides (left/right) for better readability.
Here’s an image showing what I have now:
What I tried so far:
- I tried splitting them into two separate panels, but I want to overlay them in the same panel for better visualization.
Example of my separate panels:

My question:
- How can I fix the overlapping bars issue and show the first column properly in the combined graph?
- Is it possible to overlay two panels on top of each other in Grafana? (e.g., like layers)
- Are there any plugins, custom panels, or advanced configuration options that can help with this?
I searched a lot but couldn’t find a solution for either fixing the bar overlap or overlaying panels together.
Thanks a lot for any help or suggestions!