
hi,
i configured Prometheus and it worked well. Now I get it in Grafana and configure it.
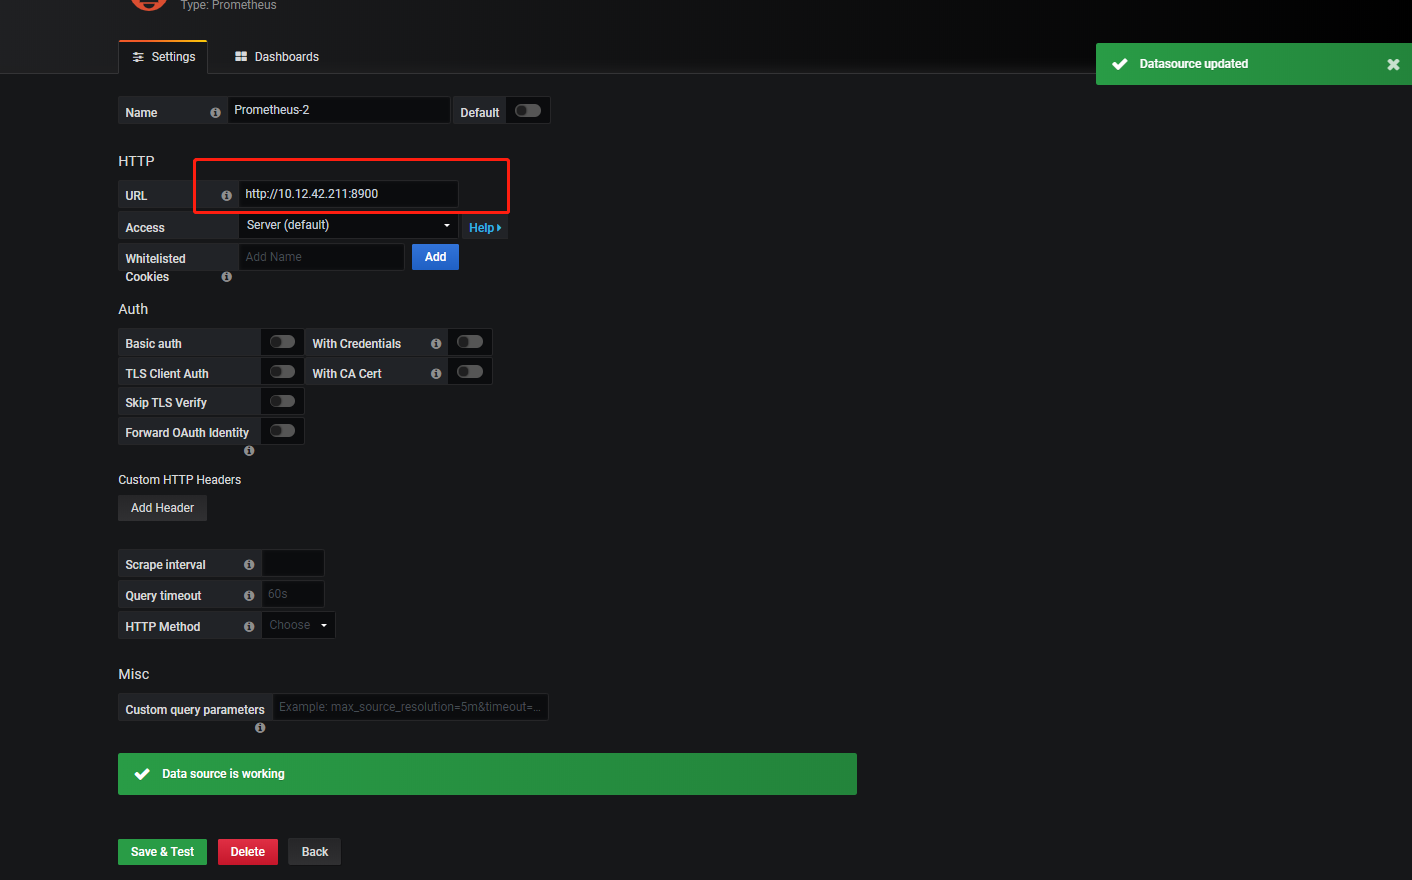
Then import the Dashboard template. Howerver, no data is shown in the selected dashboard.
HELP!
You need to have a look at how the panels are set up - simply importing a Dashboard is probably not enough. I’d start be checking the queries on each panel in your dashboard and go from there. Might be as simple as having to point each panel to the correct data source.
