Hi,
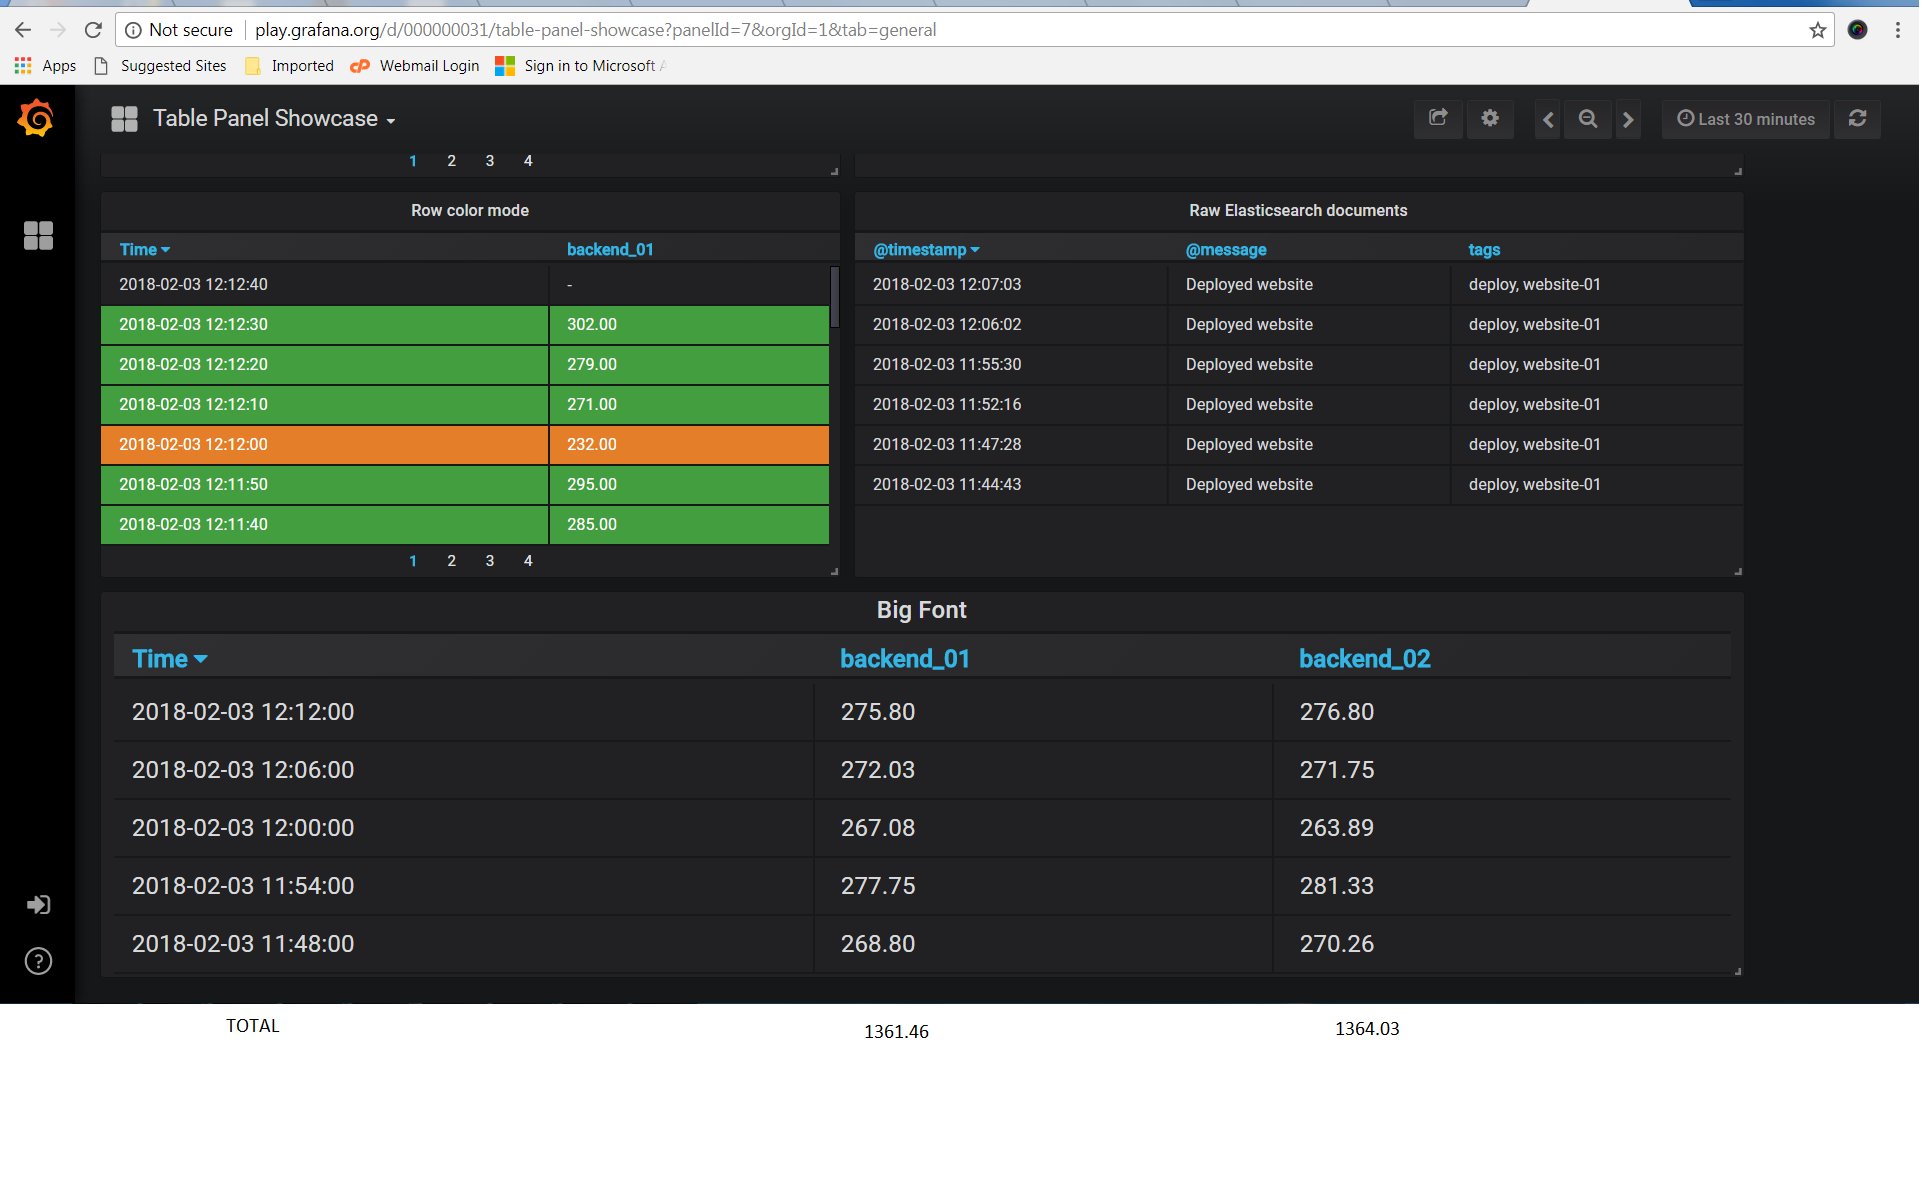
I found that calculation is only possible in Table as annotations, in time series as rows or time series as columns also it is displaying only values why cant we have calculation at the bottom of table for every column like image below.
Sounds like this feature request:
opened 04:12AM - 25 May 16 UTC
closed 05:22AM - 22 Nov 21 UTC
type/feature-request
prio/medium
area/panel/table
Please include some basic information:
- What Grafana version are you using? 3.0… .3
- What datasource are you using? InfluxDB
- What OS are you running grafana on? CentOS 6 64bits
- What did you do?
- What was the expected result?
- What happenend instead?
Hello,
I am using Grafana and InfluxDB for reporting our Platform.
I have to report some metrics like : Number of New User daily , Number of Active Users Daily, Income Daily, .. etc
I used the Table for reporting it , something like :

Now, I need a aggregation feature for each column at the end ( or the top) of this table , for example :
- Total Revenuef of This Table Result, Column "Revenue"
- Total Number of New User This Table Result , Column "N1"
- Average Daily Active User of This Table Result, Column "A1"
Each Column has it's own defined aggregation function ( or Disable)
I appreciate for what you are doing.
Thank you
It looks like something that we would like to implement but it is not on our current backlog.