-
What Grafana version and what operating system are you using?
Grafana 12.0.0 (OSS, self-hosted)
Prometheus 3.3.1
Debian 11.11
-
What are you trying to achieve?
The end result I want is a heatmap: time on the x-axis, buckets on the y-axis, and cell shading by the histogram count of that bucket for the time range of the cell. I mocked up some actual data in Excel of what it should look like:
-
How are you trying to achieve it?
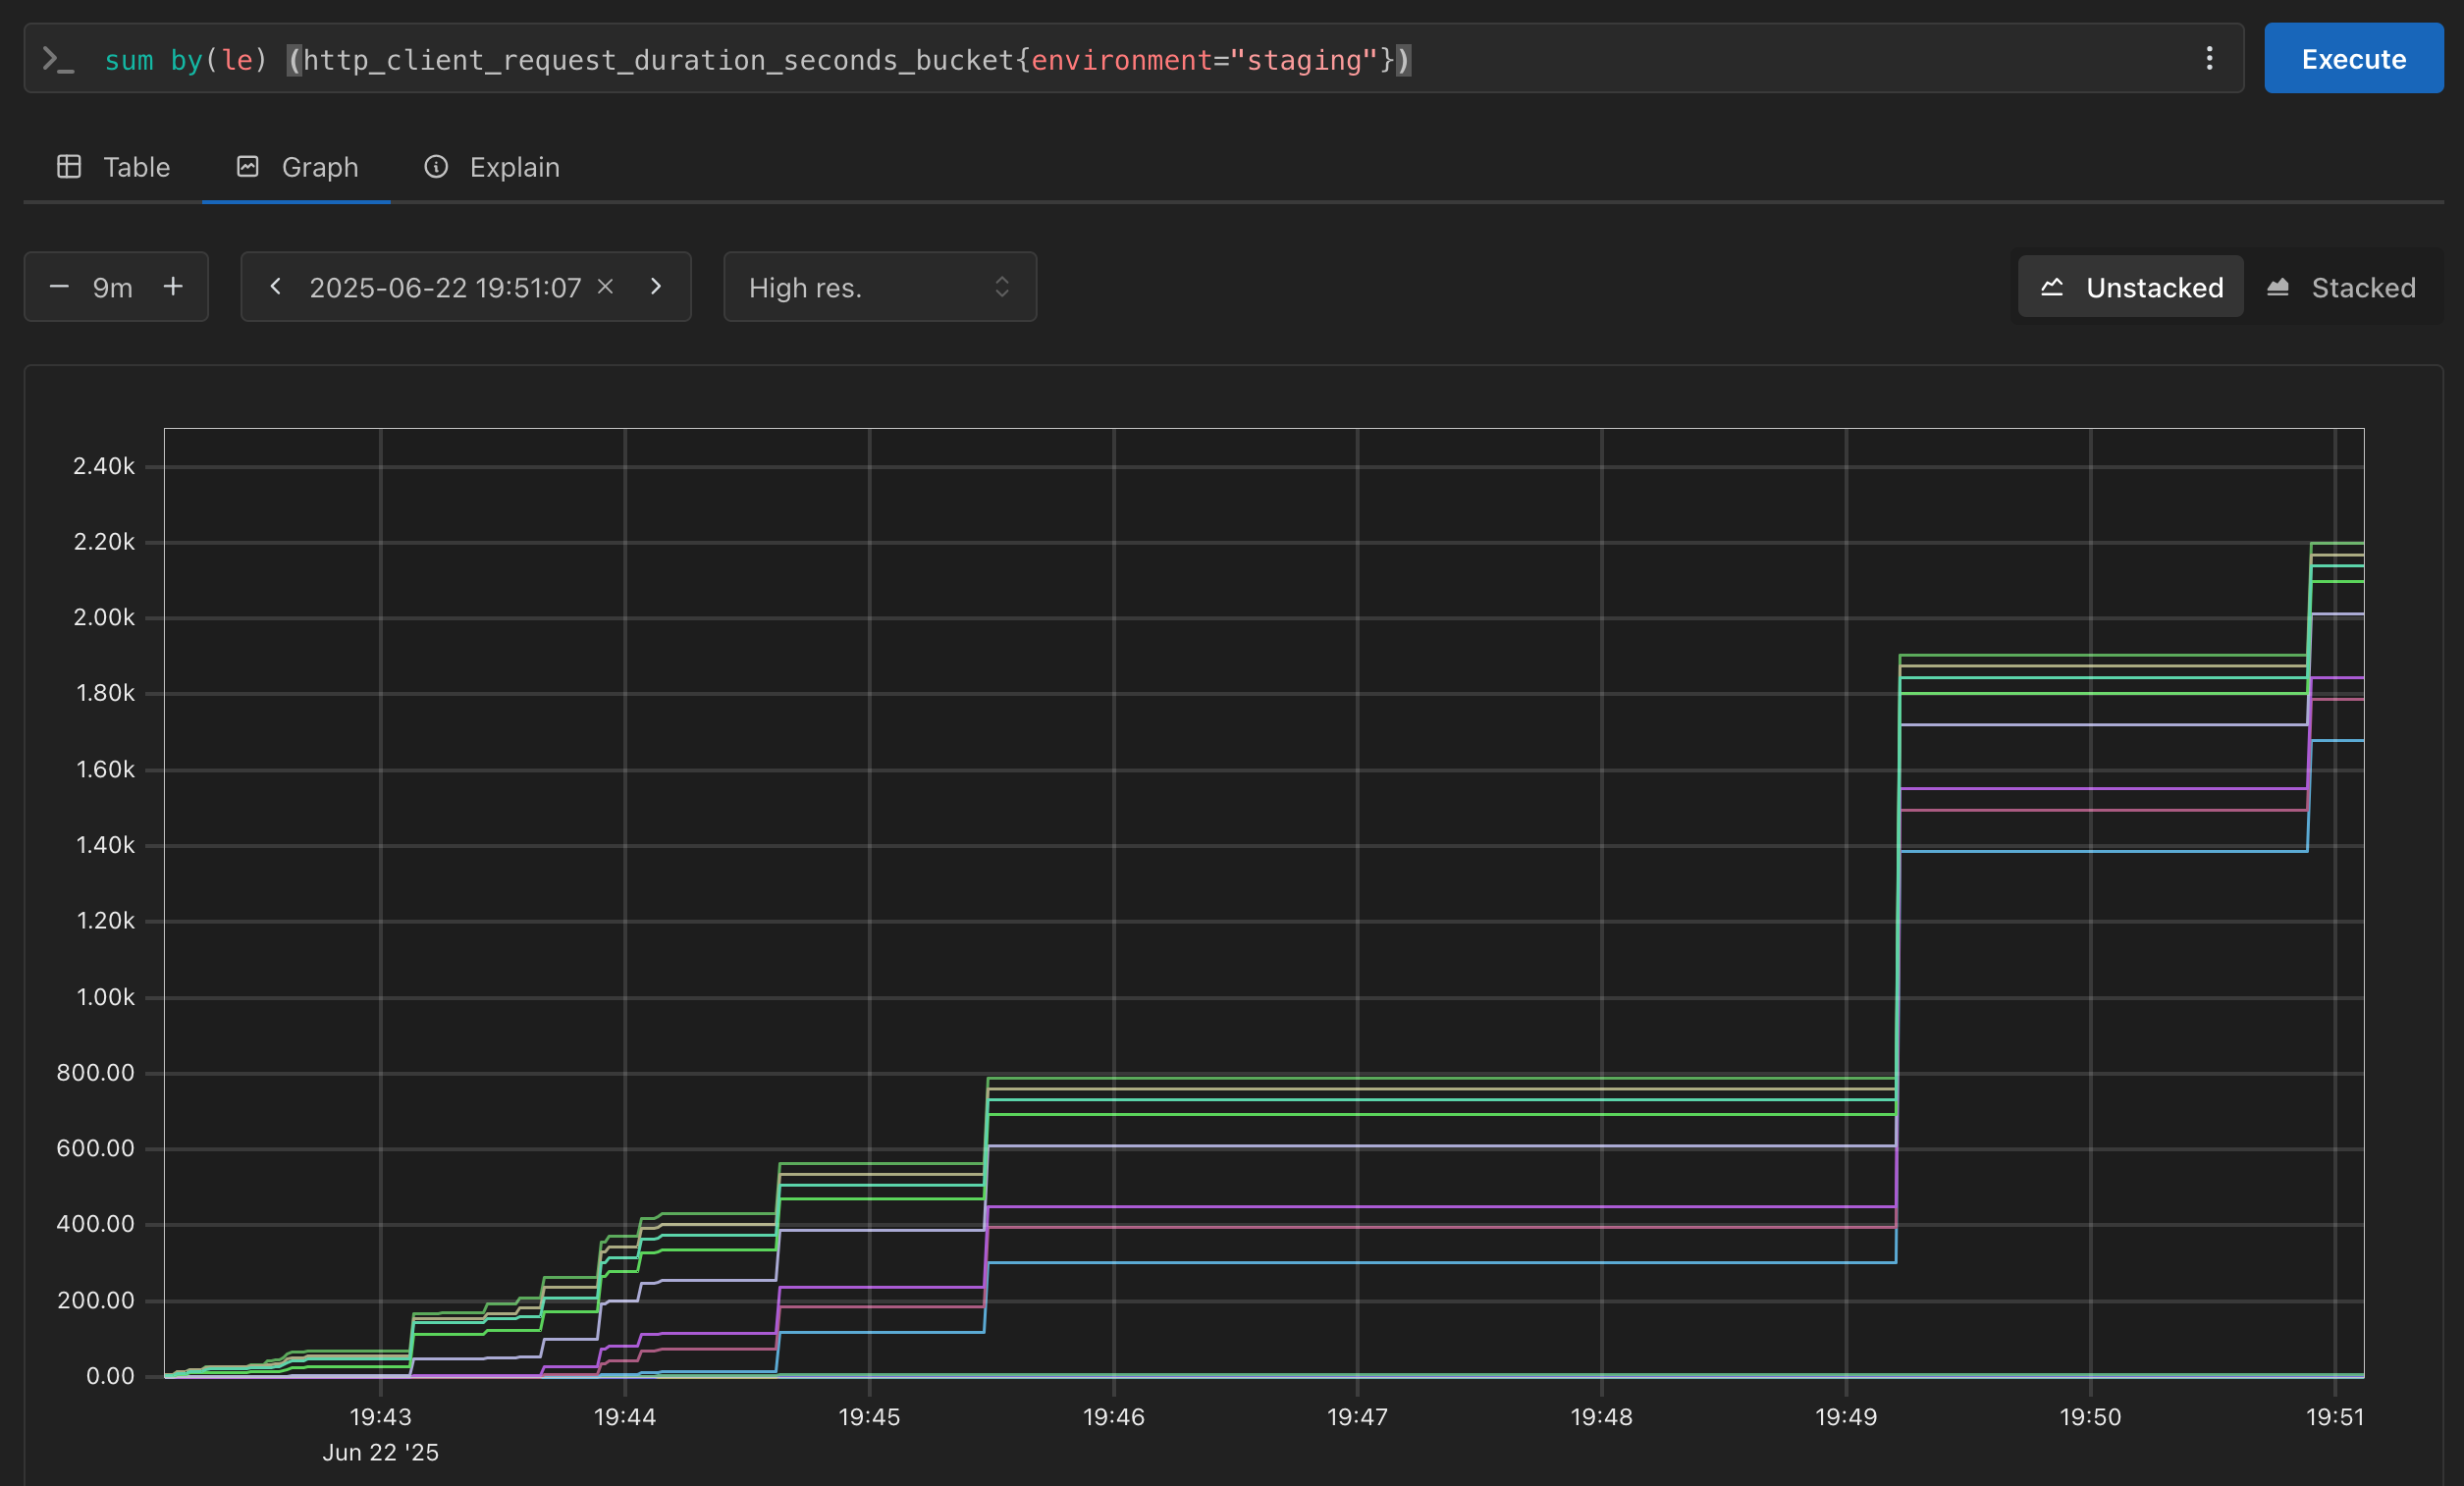
I can query the data in Prometheus and see that the raw data matches my mockup as expected:
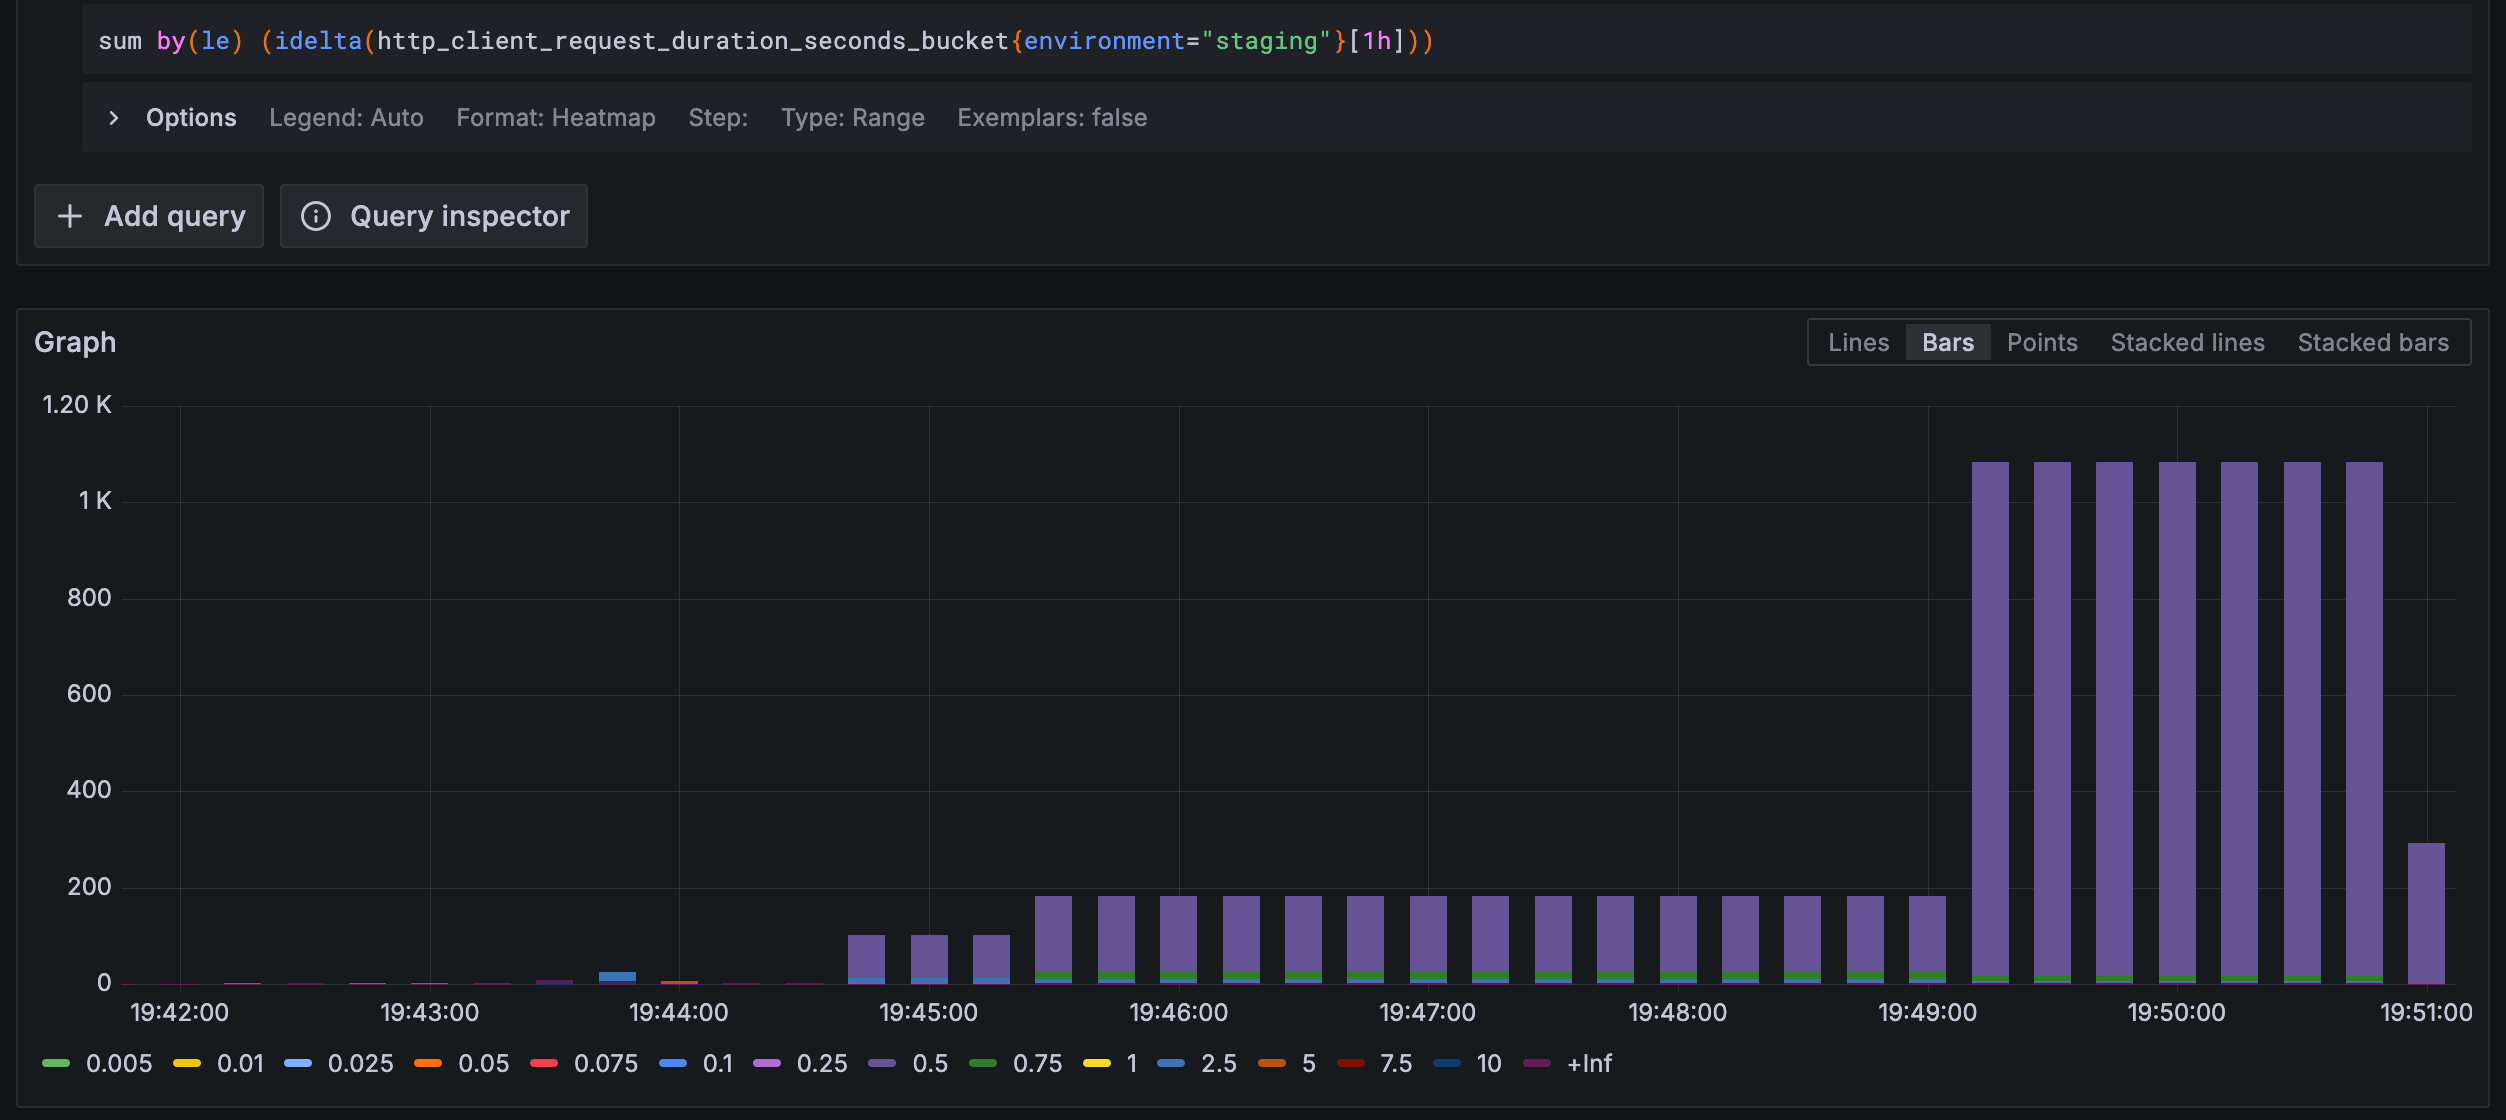
What I can’t figure out is how to calculate and display the delta values, not the cumulative-over-time. I tried an idelta with a long range so it would always get two data points…
-
What happened?
… but it “drags out” to the values instead of showing just the values in each bar’s time slice, which makes it look like we had way, way more requests than we actually did:
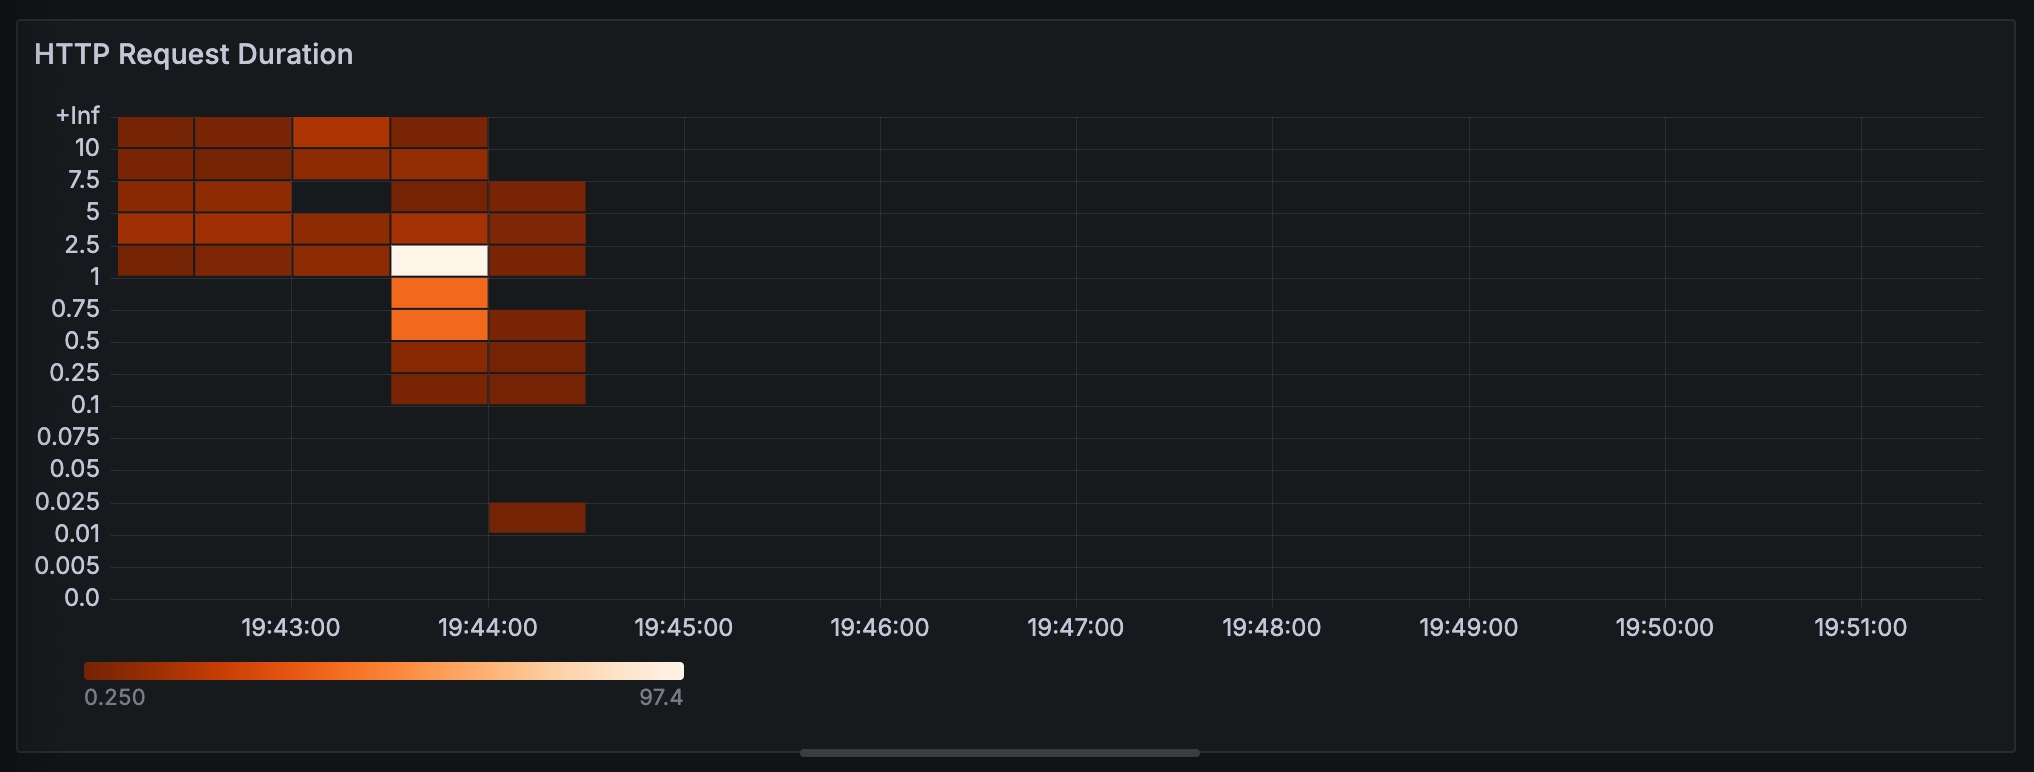
This is the same idelta query in a Grafana heatmap:
-
What did you expect to happen?
Compare the heatmap to my mockup, and you can see values are repeated in multiple columns where they should not. I understand how this might be an artifact of the idelta range function, so I’m guessing that is not the right approach here. I don’t want a statistical approximation, I want the actual data points. I’m guessing I need to apply a few functions, or possibly even multiple queries to get what I want, but I’m at a loss for getting from here to there. Any help or pointers are greatly appreciated.
-
Can you copy/paste the configuration(s) that you are having problems with?
sum by(le) (idelta(http_client_request_duration_seconds_bucket{environment="$environment"}[1h]))
-
Did you receive any errors in the Grafana UI or in related logs? If so, please tell us exactly what they were.
No
-
Did you follow any online instructions? If so, what is the URL?
I watched Understanding Counter Rates and Increases in PromQL | Reset Handling, Extrapolation, Edge Cases to try to get a better understanding, and it was helpful, but it kind of skips over the raw data and goes to statistical interpretation with quartiles… In my case I want the actual raw data, but can’t figure out how to “undo” the “cumulative-over-time” that stretches out the data and just show counts when they were recorded.
2 Likes
Maybe How to visualize Prometheus histograms in Grafana | Grafana Labs will help.
Generally, Prometheus is not a good storage for sparse data, so that can be also a problem.
I’m re-reading that blog post now, but the increase function it mentions mangles the data further.
I don’t understand your comment about sparse data. We use Prometheus because it’s a time-series database, and have not encountered issues drilling down to specific measurements in Grafana, but we are really just getting started with our observability. Is there a different TSDB we should be using? The data is being generated from OpenTelemetry, and as I mentioned above I can see the discrete datapoints matching what we’re sending when I query Prometheus, I just don’t know how to translate the way they’re stored into the visualization I want.
You will stop sending metric (e.g. counter) to Prometheus, but range query will be returning still the latest value for next 5 minutes.
It will be question how it is implemented for histograms.
So I need to do a series of instant queries instead of a range query? And those somehow can be merged into a single heatmap?
Using the exact function combination from the article is an even worse result:
are you in the POC stage of using prometheus? or are you open to using another TSDB
I’m open to looking at another TSDB. We currently use Alloy/Prometheus/Loki/Tempo/Grafana, but other than node exporter on some servers we have not invested a lot of time in custom development.
Which TSDB(s) should I consider?
can you please share some sample data? maybe as csv and obfuscated if sensitive
CSV of the data in my example above: sample histogram data · GitHub
is this the raw data as is from source with column names such 0.005 etc?
Those are the histogram buckets, yes. If you want it in a different format, let me know.
The source is OpenTelemetry, so it’s coming in as JSON… that’s very verbose though.
1 Like
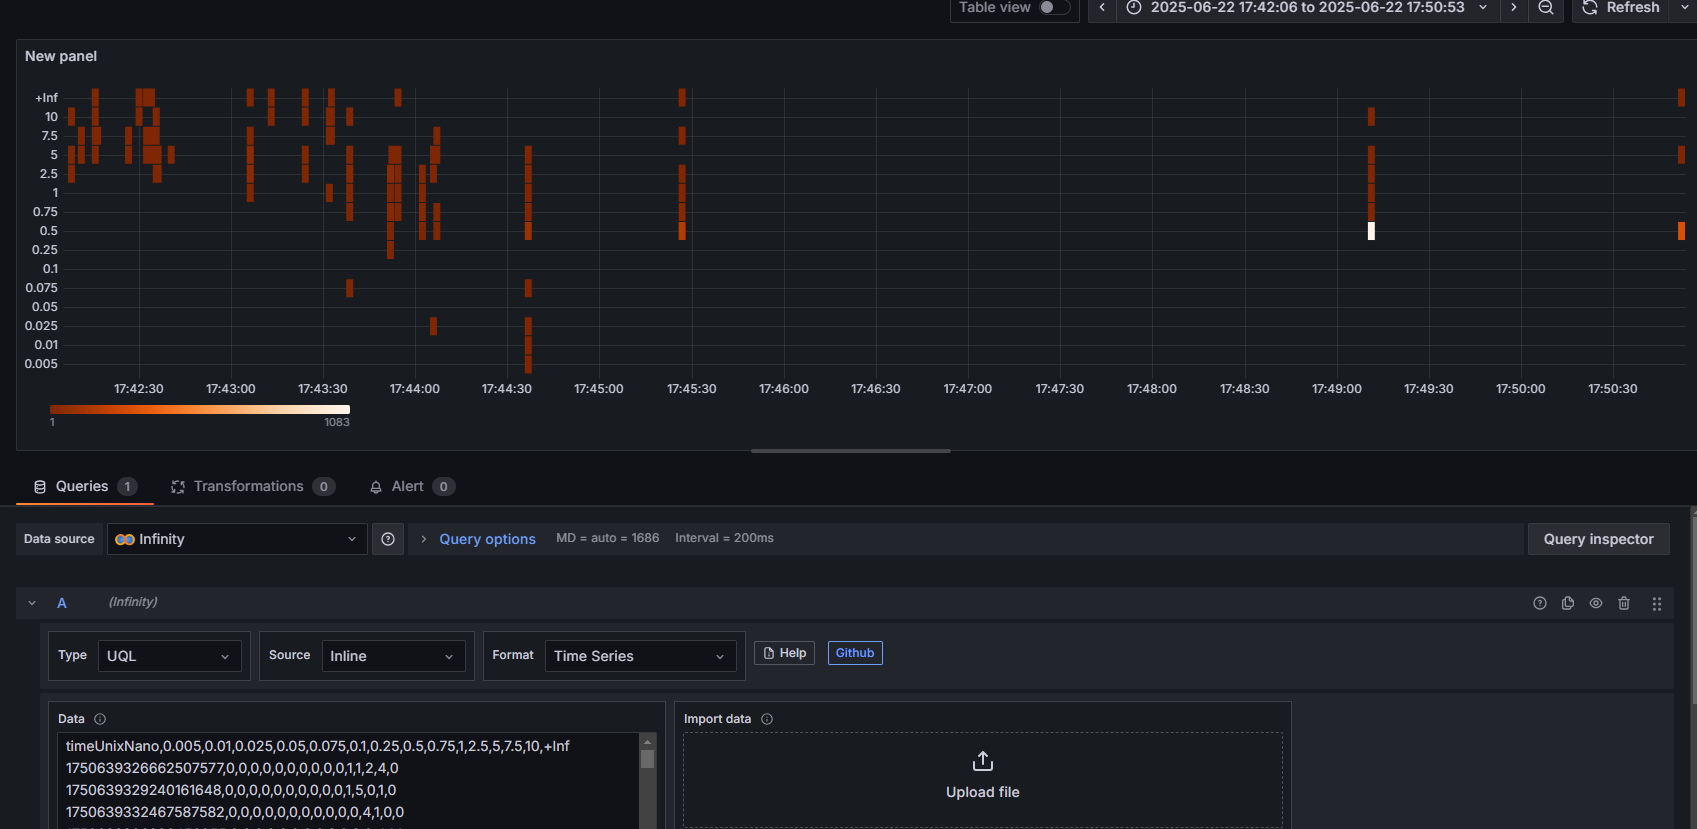
POC. is this closer to what you need?
2 Likes
Yes, that’s essentially it, I would just widen the interval so it’s more legible.
1 Like
I would recommend either influxdb with flux language or your basic db such as mysql or postgres?
not sure why there are gaps between the data points, compared to your excel setup
1 Like
Not sure which gaps you are referring to; it looks like your graph is just divided into a more granular resolution than OTel was reporting.
I’ll look at InfluxDB. We use MySQL but it’s not great for TSDB… was actually wanting to move some TS data out of MySQL, but this issue with retrieving raw values from Prometheus gives me pause.
That sample CSV is a sum of ~20 underlying time series histograms and is obviously only a 8-9 minute slice of a 24/7 stream of data.
1 Like
Unfortunately with InfluxDB’s commercial licensing for v3, it’s not a viable option for us. Guess we’re stuck with SQL.
How about previous version v2.7