What data source are you using? Looking at some of the data points I can see that they’re outside the time range of your screenshot - how come? Maybe you can include a screenshot of the metrics tab.
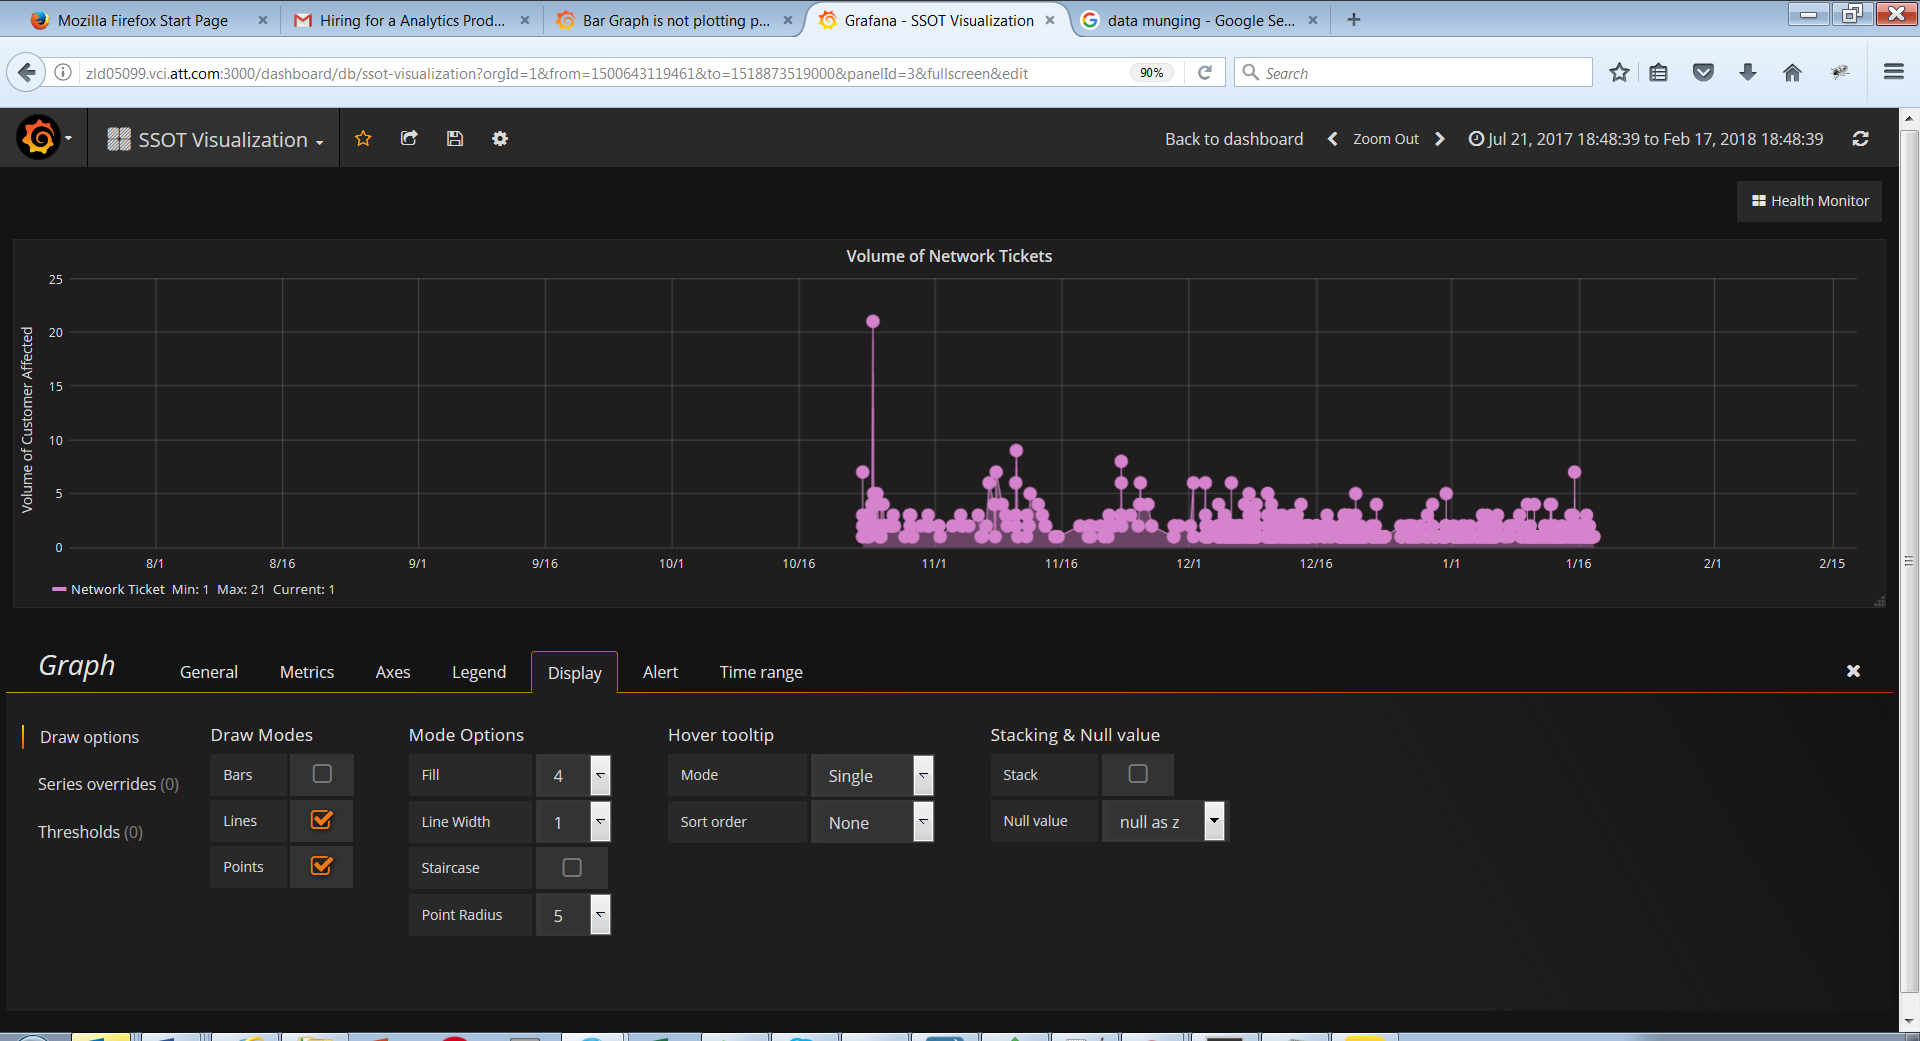
Yes when i use bar graph plugin , data points goes outside the time range but when i use line graph it remains normal and correct according to the data points .
Even if i add …
its not working …
i had same issue from long time with many data …
all data points will work with line graph properly … bar graph is not plotting properly
So would any of the following queries work better? I’m a bit unsure about your time_sec column which may result in that below queries don’t work. What values and data type does time_sec column have?
SELECT
  $__timeGroup(time_sec,'5m') as time_sec,
  entity_count as value,
  "Network Ticket" as metric
FROM networkTicket
WHERE $__timeFilter(time_sec)
GROUP BY 1
ORDER BY 1
SELECT
  cast((time_sec/1000 as signed integer)) as time_sec,
  entity_count as value,
  "Network Ticket" as metric
FROM networkTicket
WHERE $__timeFilter(time_sec)
GROUP BY 1
ORDER BY 1
SELECT date_trunc('hour', observation_date) AS time, COUNT(date_trunc('hour', observation_date)) AS "Total"
FROM global
WHERE  $__timeFilter(observation_date)
GROUP BY time;
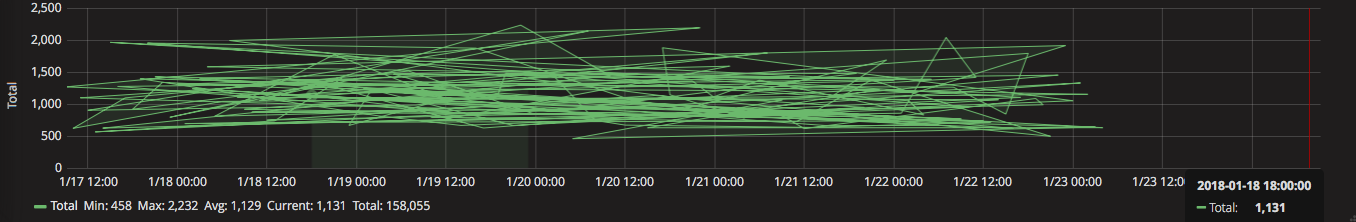
I am struggling to understand why the production graph is not rendering correctly. Both running 4.6.3.
Do you run the same Grafana versions on both environments? Are you using the same mysql instance or different - maybe one of the instances sorts the results automatically and the other don’t?
You should always add the ORDER BY to make sure that the data are sorted correctly.
Regarding the display as graph problem you first had I can confirm that using the $__timeGroup macro of for example 10s resolves the problem even though all my timestamps were written each 10s. Cannot answer why this is, but comparing with the postgres data source it doesn’t have the same problem.
$_timeGroup macro function is not included in latest stable Grafana release v4.6.3, but are included in the latest nightly build, i.e. latest commits from Grafana master branch.