[Solved] Bar chart duplicating and showing non-existant values

Hello,

Running version 5.3.4

I’m running this query that shows how many tickets were created on a specific queue.

This is my query:
query

The query works fine on the database but grafana is showing values where there isn’t any:

This is my graph:
graph_2

Now, when I select an individual series the graphs plots it correctly where it should be:

s1
s2
s3

Thank you everyone.

1 Like

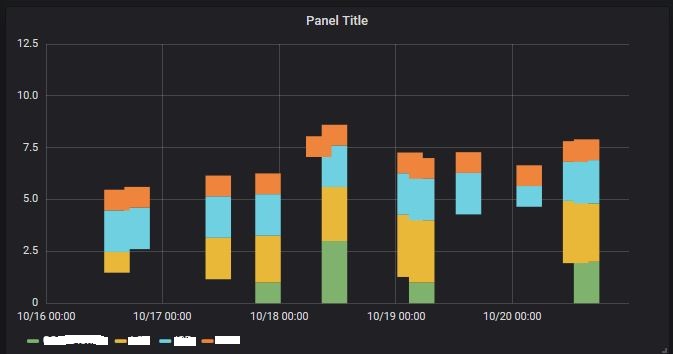
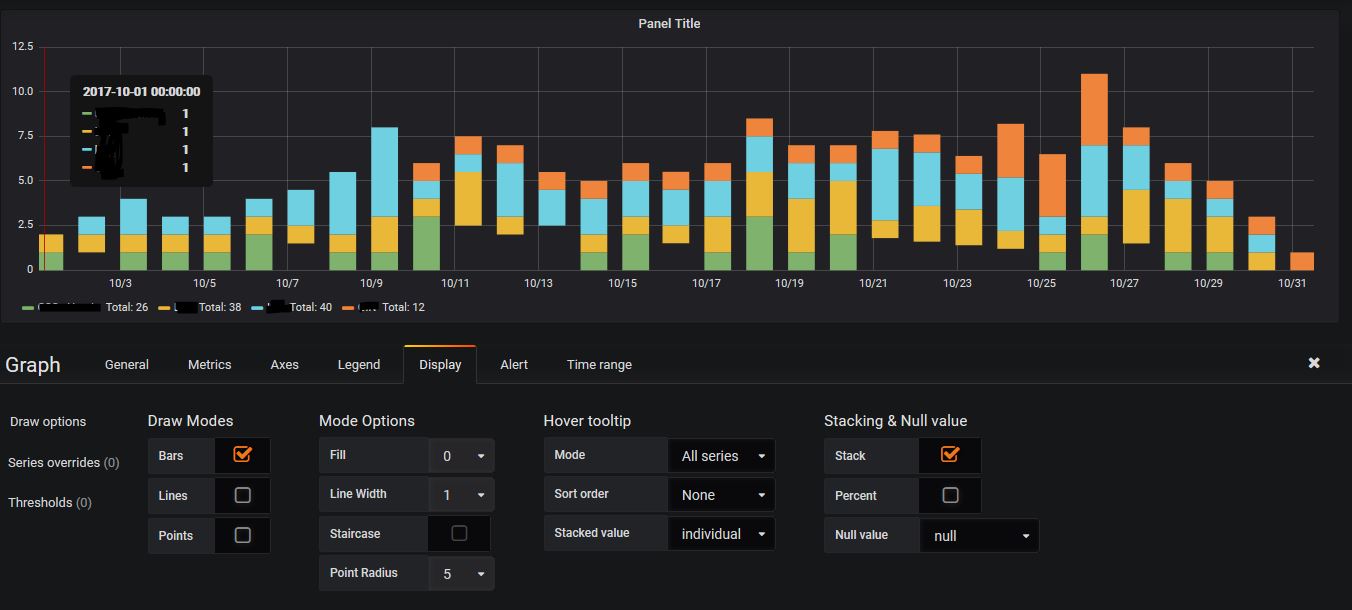
Hello, so I’ve been making some progress on my issue, however my bar chart still shows values where there isn’t any and I belive this is because of the line chart:

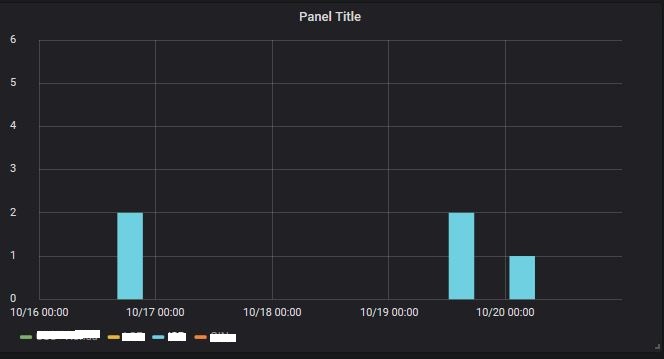
Notice that even though I don’t have values in the green data series the second series won’t start from the bottom.

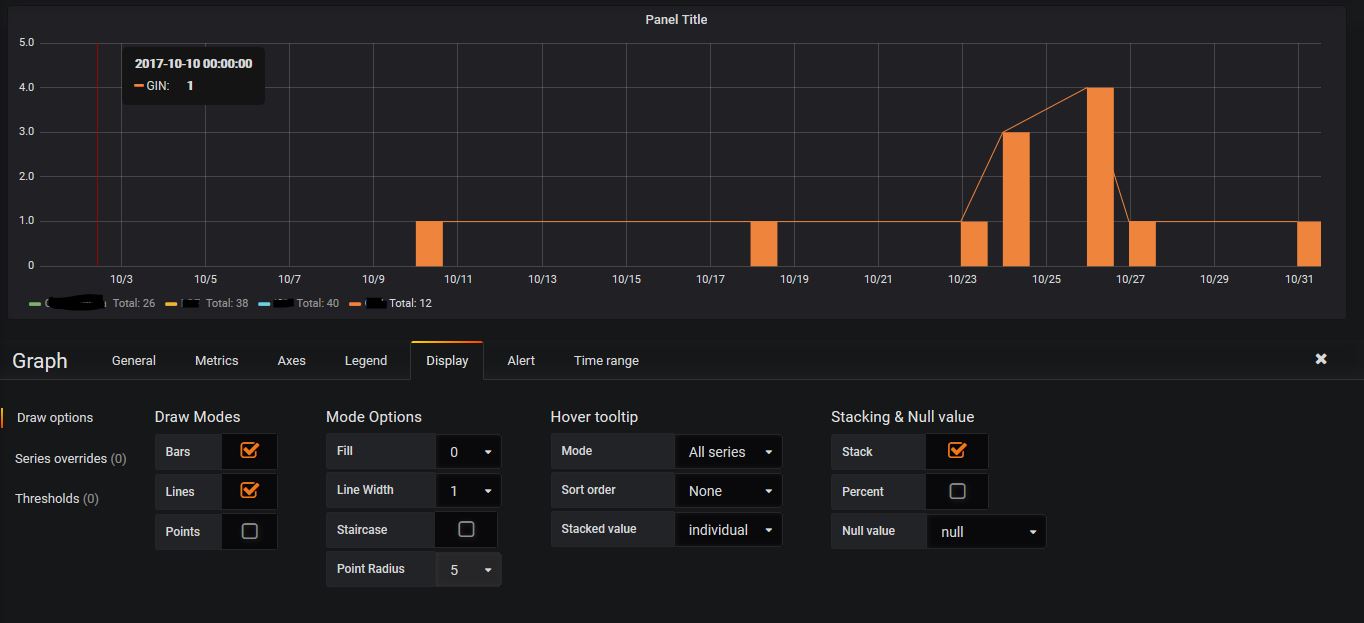
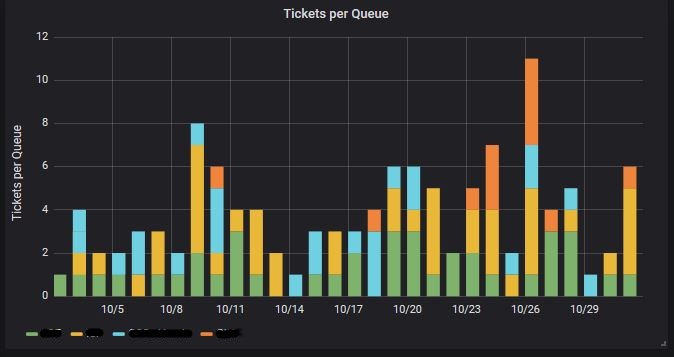
The orange values that are mostly non-existant are there because the line is connecting the values and the bar chart adds that value (see second image)

Orange series values:

Disabling the line chart does nothing, my graph still shows wrong data and values that do not start from the bottom.

At this point I’m not sure this is a problem with Grafana ploting this data or I’m missing something.

1 Like

Finally got this working.

I had to use $__timeGroup and now my query is like this:

29_4

And the result I was expecting:
29_3

Credits where it’s due:
https://community.grafana.com/t/how-to-display-0-for-series-value-when-value-is-null/6911
https://community.grafana.com/t/issues-with-stacked-bar-and-timegroup-macro-and-mysql/5272

2 Likes