Hi,
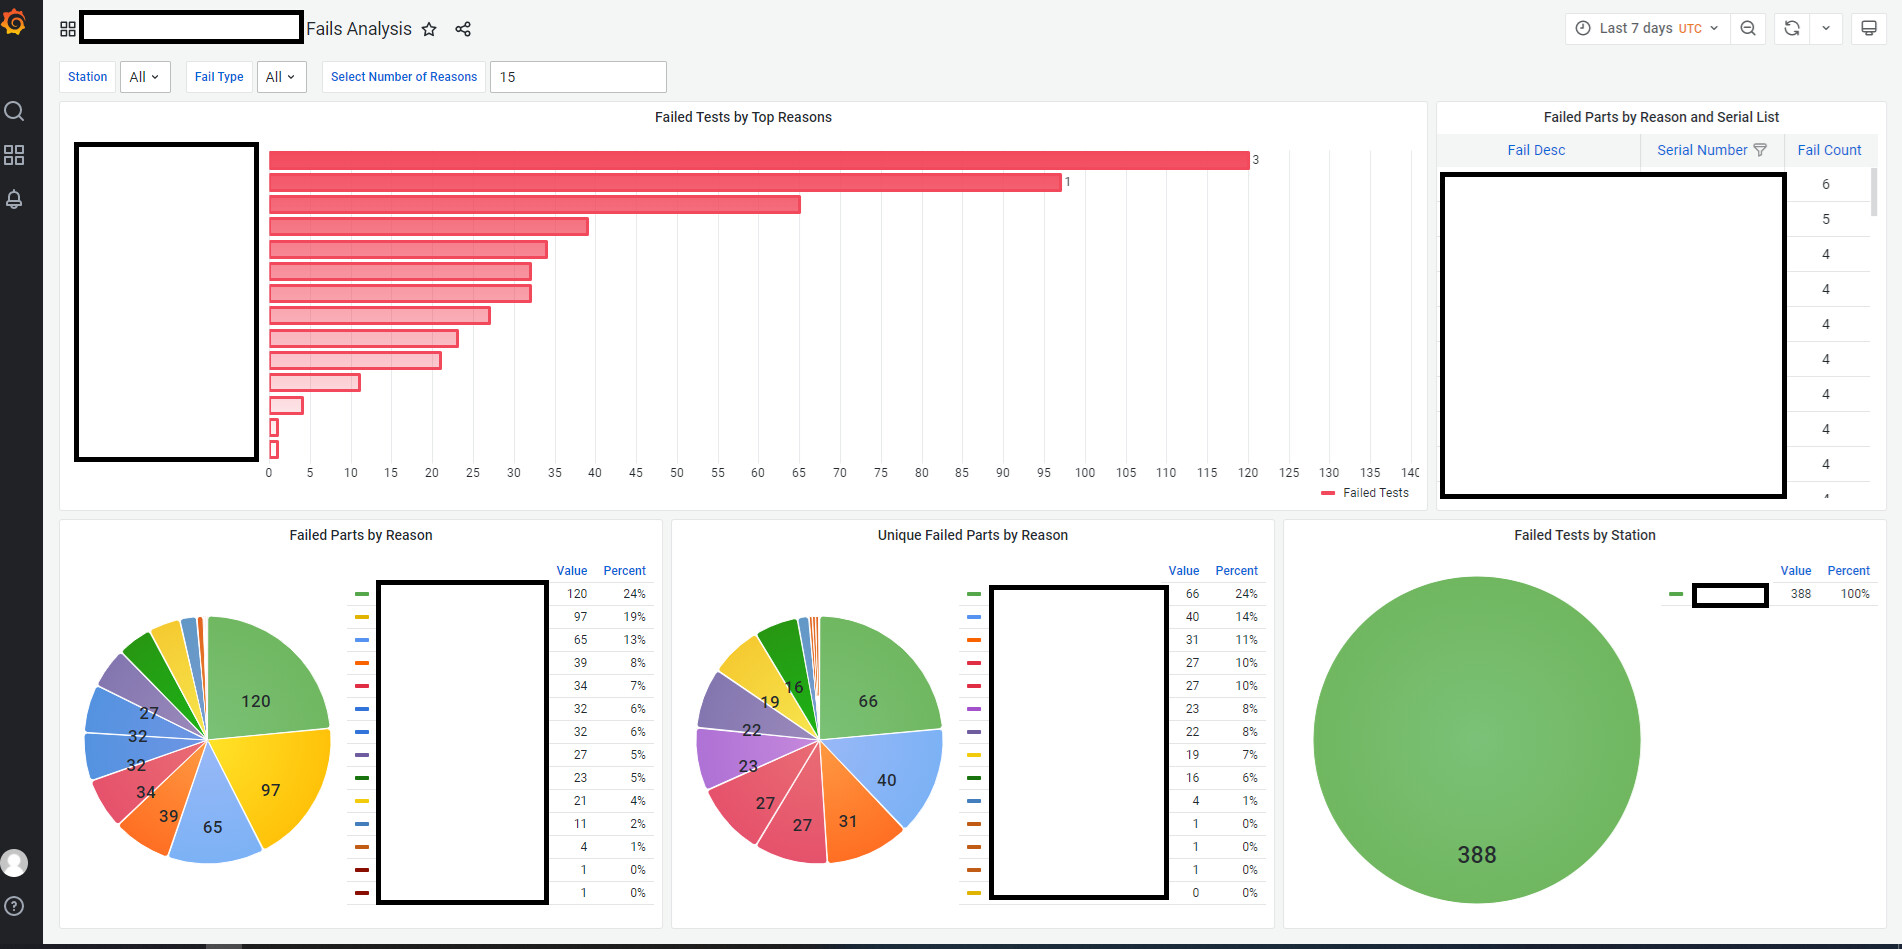
Found a small bug on the value at the tip of the bar, when I change the time range the value doesn’t update
It’s not really an issue for me I just hid the value and people can read of the scale.The left Pie chart is the same data for reference and the bar is correct just showing 3 instead of 120 after time range increase
Do you think you could reproduce this bug with mocked up data? Def seems like a bug but it would be awesome to have steps for reproduction, and your data seems sensitive…
Yeah sure, not really sensitive but just don’t want it public!
I’m just after getting a plot is not defined error while trying to replicate
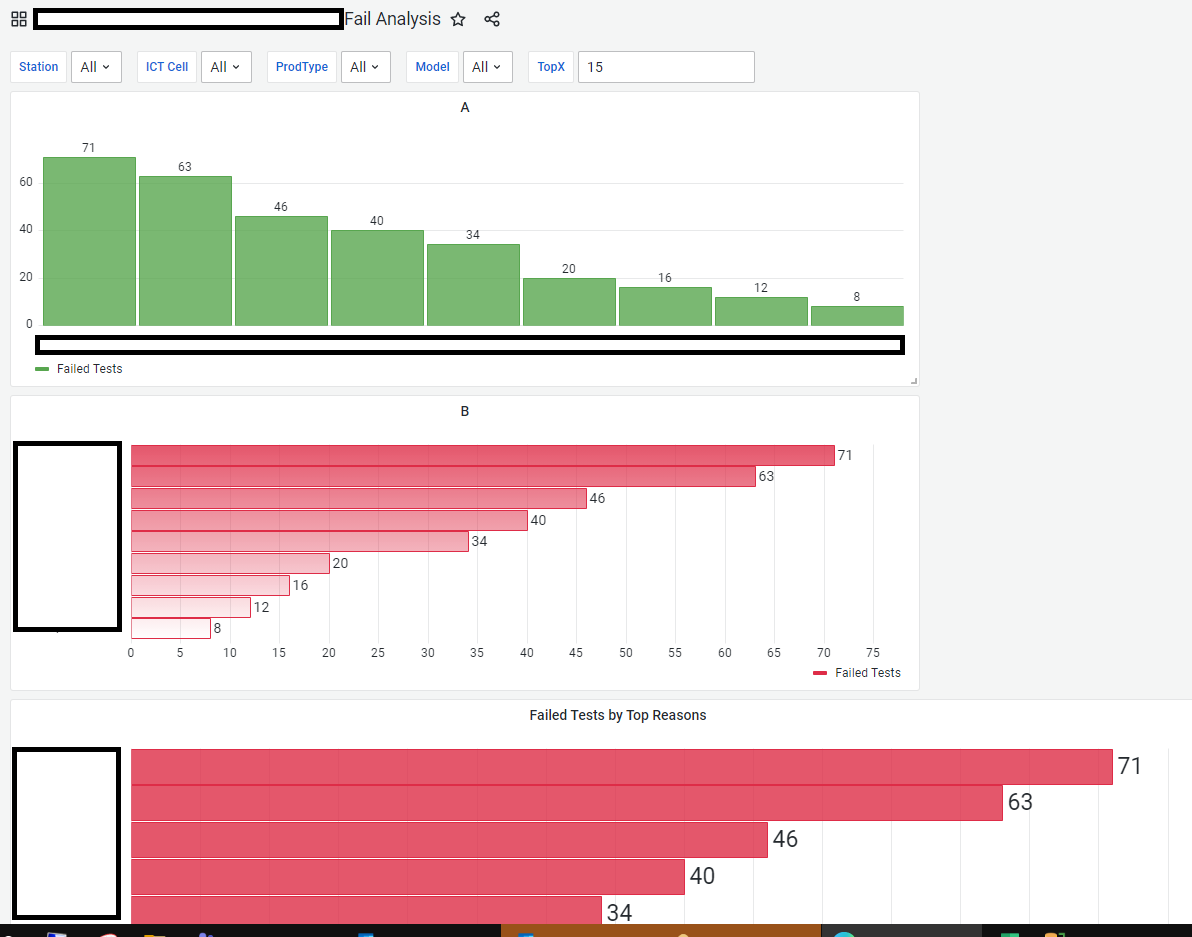
I’ve copied the query to B with some changes in Panel options and A is no changes to options just sql into the query and set to Table and Bar Chart
And if I change the time range, or the TopX it will fail like below
Just a note the SQL for the Bar Chart and Pie Chart on left are the same
SELECT TOP($TopX)
       CASE WHEN [FailReason] IS NULL THEN 'Blank'
            ELSE [FailReason]
            END AS 'FailReason'
      ,COUNT(PKID)  as 'Failed Tests'
  FROM           [tbl_Tests]
  WHERE          [TestStatus]      NOT IN    ( 'Pass' )
  AND            [testExecutedAt]  BETWEEN   $__timeFrom() AND  $__timeTo()
  AND            [TestStationID]   IN        ( $Station )
  GROUP BY       [FailReason]
  ORDER BY       COUNT(PKID) DESC
And the Unique fails is just a distinct count of Serial number of production parts through tester
But the point I’m getting at is the Bar Chart seems to be the problem but with a reload of the page or going into view or edit, it resets until it errors again
Hi @anon70503803,
This was solved with update to 8.1.5
( Was on 8.1.4 with the error message and 8.1.2 at the start of thread )
Issue closed on Github
Bar graph does not display correct numerical value · Issue #38410 · grafana/grafana · GitHub
Thanks!