Grafana v11.0.0 on MacOS
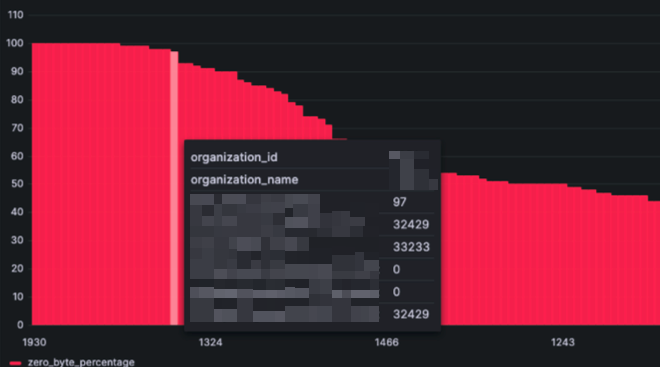
I have had a dashboard in use for months that has bar charts with 10 tooltips available upon hover. All of a sudden the tooltips are removed and I can’t show this information which is required. How can this functionality be fixed?
The bar charts are using a SQL query to return 10 values; the first is an integer, and the other 9 I am converting to text, so that they appear in the hover tooltip. I do have tooltip mode set to All. The dashboard setting for Graph tooltip is Default.
Here is an example of the query setup. It used to only show one bar per organization_name with the x axis as organization_name and the y_axis as total_zb. All of the values I converted to text would appear in the hover tooltip. Converting the values to text enabled them to appear in the tooltip.
select
organization_id::text,
organization_name,
sum(zb_tsc)*100/sum(tsc) as total_zb,
sum(tsc)::text as tsc,
sum(zb_tsc)::text as zb_tsc,
sum(tsc_2g)::text as tsc_2g,
sum(zb_2g_tsc)::text as zb_2g_tsc,
sum(tsc_3g)::text as tsc_3g,
sum(zb_3g_tsc)::text as zb_3g_tsc,
sum(tsc_4g)::text as tsc_4g,
sum(zb_4g_tsc)::text as zb_4g_tsc
from zb
group by organization_id::text, organization_name
order by total_zb desc;
Old and good:

New and bad:


