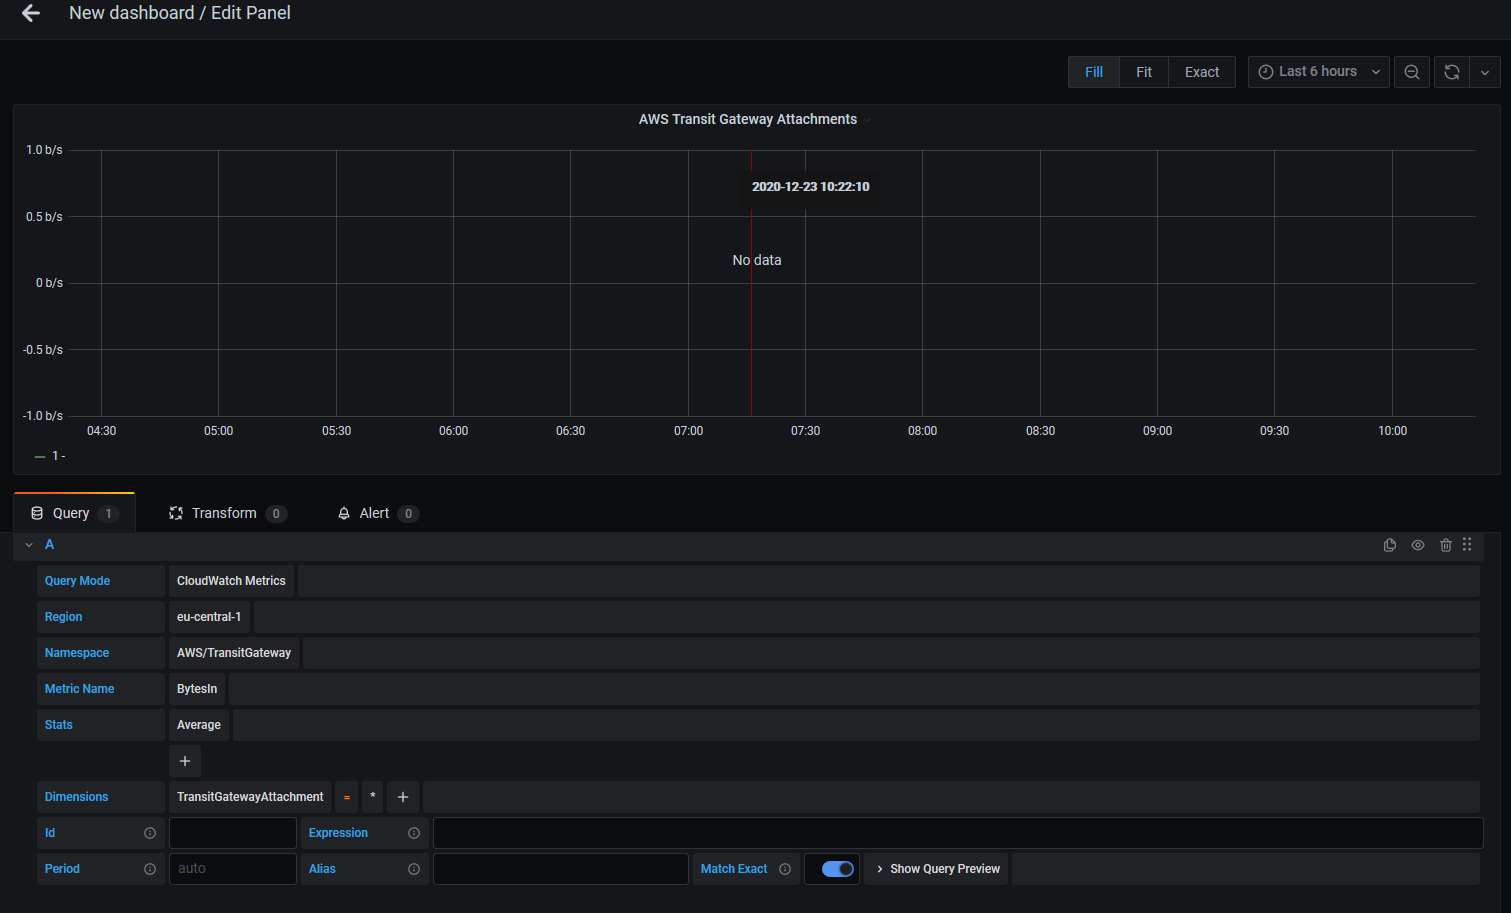
I am trying to monitor AWS transit gateway attachments using cloudwatch datasource but no data is being shown. I am choosing different attachment id but nothing is displayed. Can you please help?
thanks
I am trying to monitor AWS transit gateway attachments using cloudwatch datasource but no data is being shown. I am choosing different attachment id but nothing is displayed. Can you please help?
thanks
I would expect that you will post also your query. Otherwise nobody will be able to help you, because we don’t know what are you trying to query.
The best option will be if you can show your metric in the aws cloudwatch console. That one shows exactly metric name and dimensions, so it will be easy to compare them with the Grafana query.
Are you sure thay only one dimension is required for the filtering? See your good friend - doc https://docs.aws.amazon.com/vpc/latest/tgw/transit-gateway-cloudwatch-metrics.html
See how to ask properly Custom CloudWatch metrics not pulling data it is immediately clear that dimension is missing. It can be your case, but that’s not clear from your question.
I tried specific ones and the data is visible on cloudwatch but not on grafana
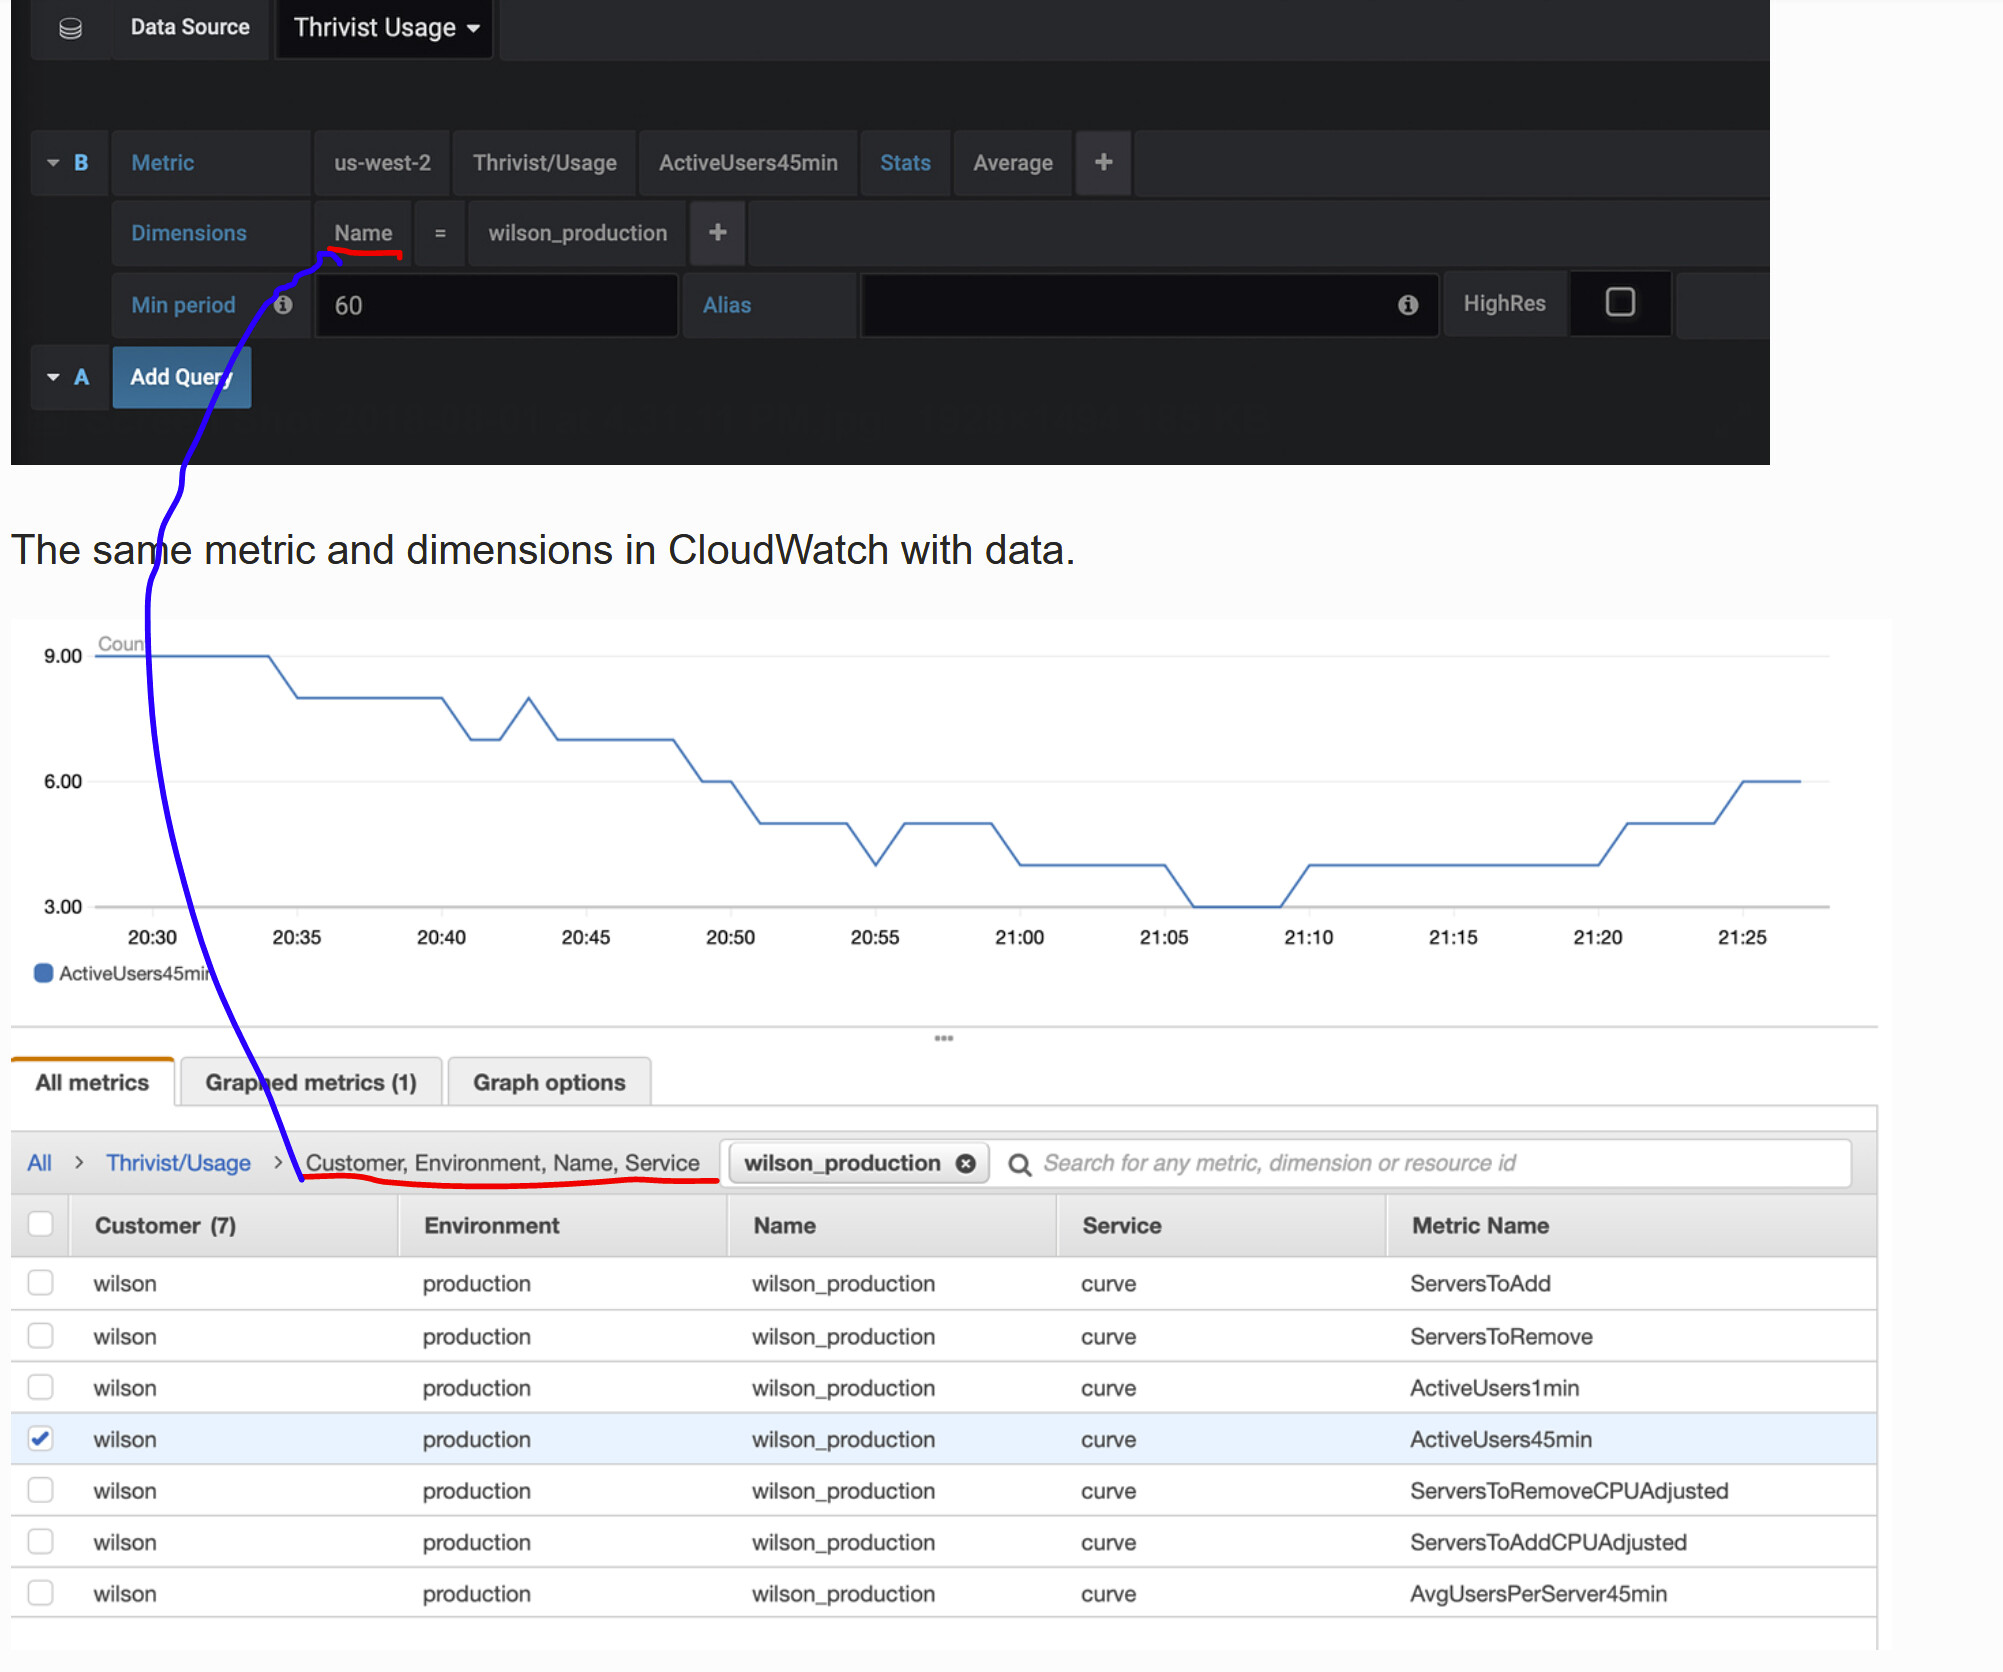
So please show that cloudwatch query, pls. Explicitly: make side by side comparison so it will be obvious what are you doing wrong. E.g. this prarticular side by side comparison means that user is not using the same dimensions in the Grafana query, but he is expecting the same data:
Correct question details will give you correct answer!