What Grafana version are you using?
4.1.1
What datasource are you using?
cloudwatch
What OS are you running grafana on?
Amazon Linux AMI
What did you do?
I’ve imported dashboard from Grafana org - “AWS Cloudwatch Browser”.
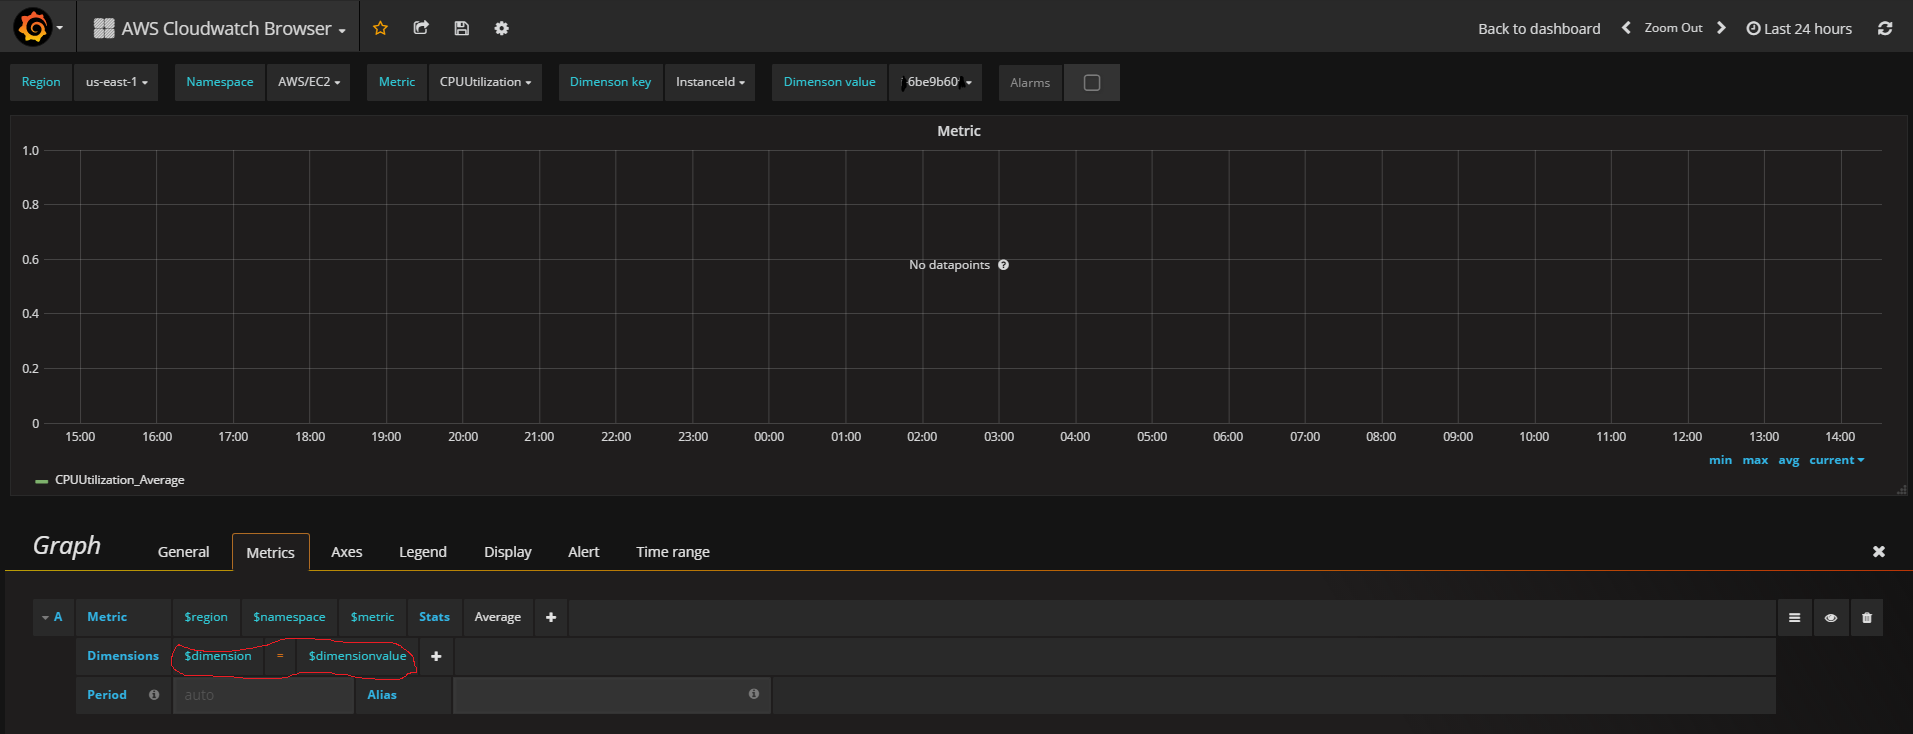
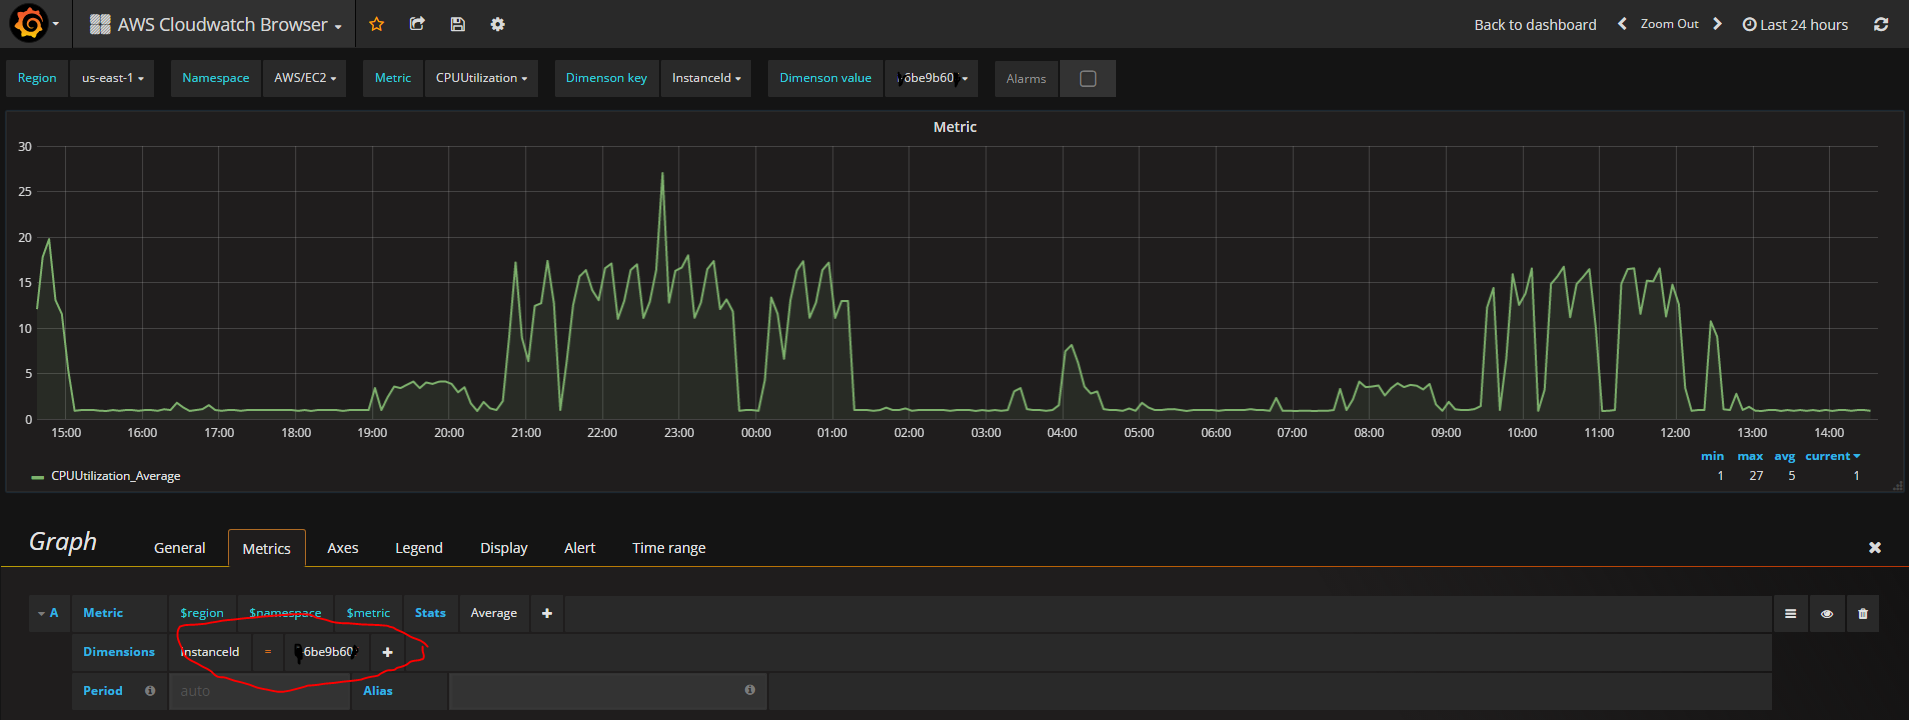
For some reason there isn’t any data displayed using the out of the box dimension template, but when I enter the dimensions manually the data is displayed properly.
The screenshot which shows using the template:
The screenshot which shows using the manual value:
What could explain this behavior ?
@torkel