I can get the AWSCloudWatch metrics to display in a panel, but any custom metrics I choose don’t load any data points even though I can verify they have data.
I am using GrafanaCloud.
I added my Custom Metrics namespace when configuring the Data Source.
The list of metric names and dimensions show up in the query configuration.
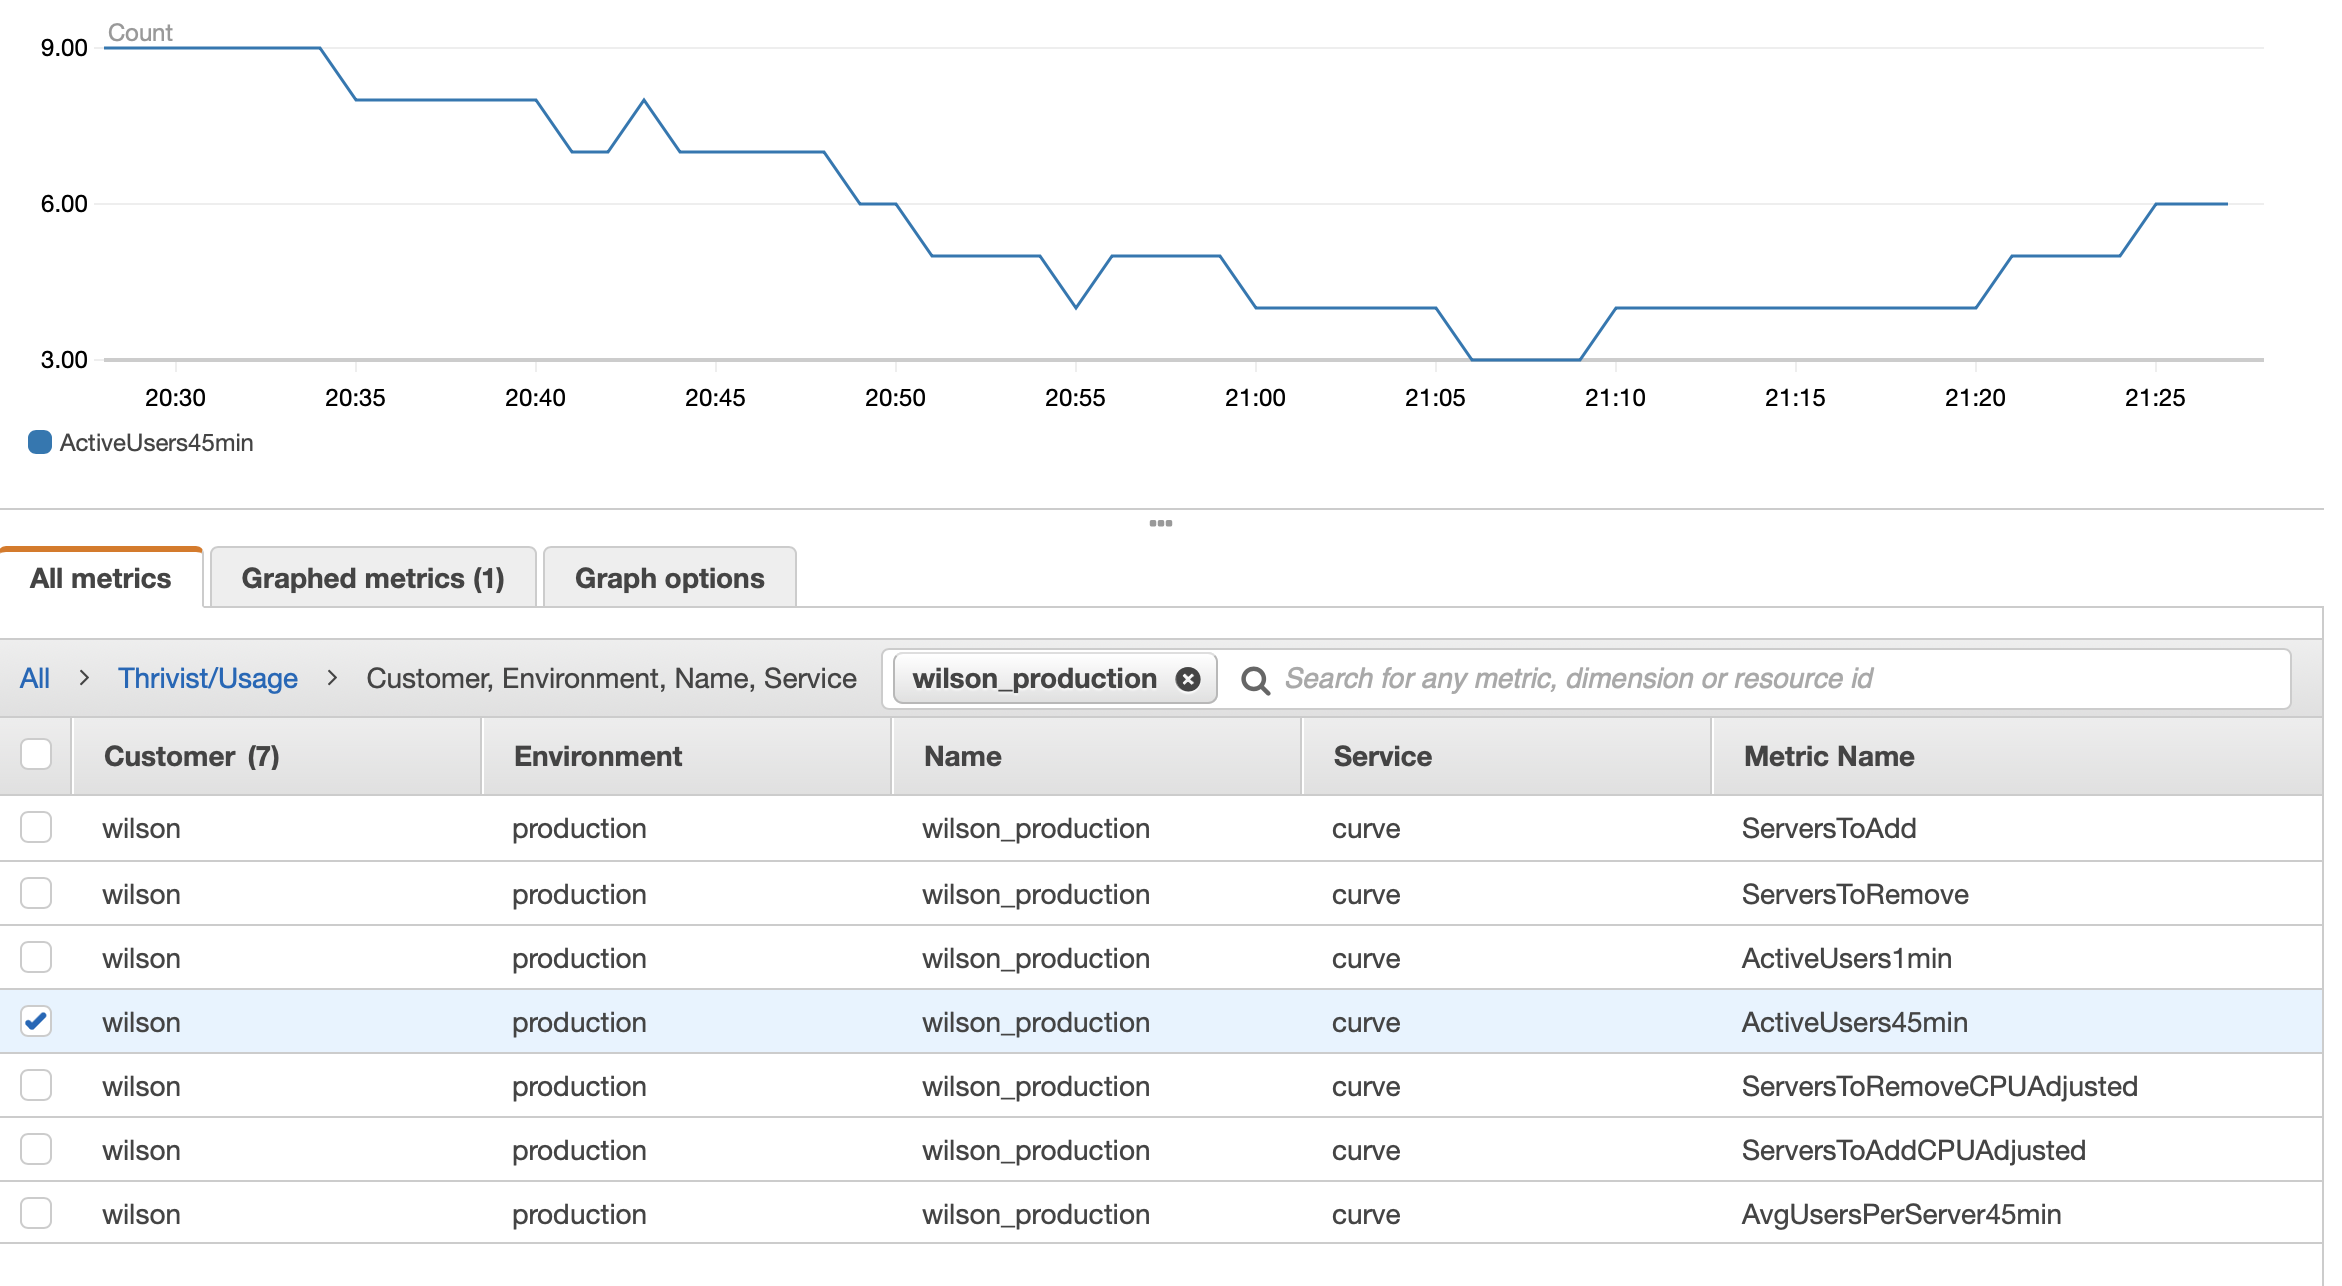
Screenshot of metric name and dimensions selected, but no data points.

The same metric and dimensions in CloudWatch with data.
I am new to using Grafana and may just be missing something simple, but haven’t had any luck figuring out what that is.
Thanks!