Hi,
I am having an issue showing my annotations extracted from an Infinity Datasource into my dashboard. I figure I am missing something, any help appreciated.
-
What Grafana version and what operating system are you using?
Grafana v11.4.0 (b58701869e) -
What are you trying to achieve?
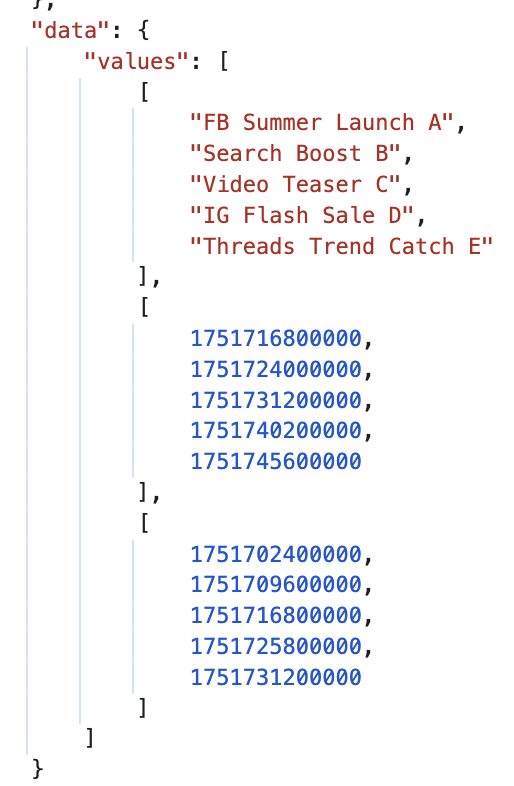
I have an infinity data source that allows me to query the latest pipeline jobs from Gitlab, in the explore panel I am able to get job status.
I am trying to show annotations in my dashboard based on that Infinity data source. -
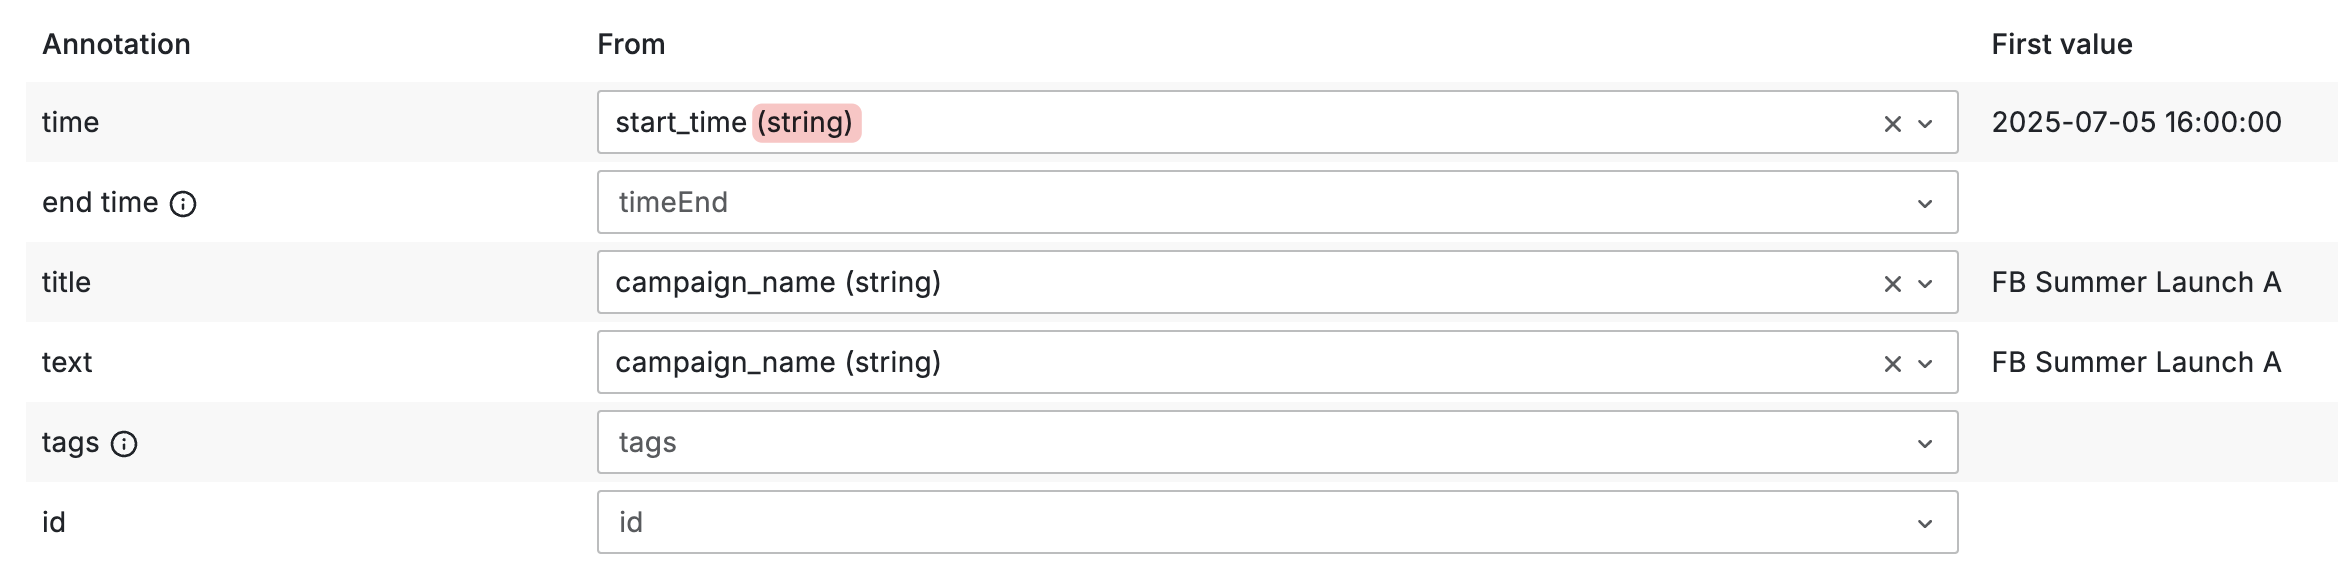
How are you trying to achieve it?
I have added the annotation in my dashboard settings and the test does show a result, the string date is even automatically converted to my timezone:
Default field string time format: 2025-02-05T15:24:01.798Z

-
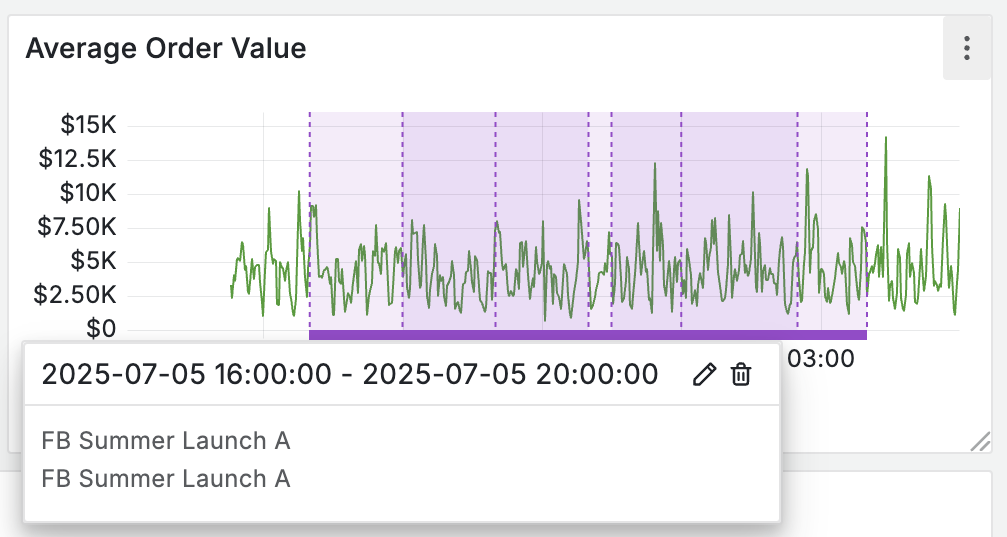
What happened?
Whatever the time range selected, the annotation shows in the bottom left corner of my graph, although when hovering it I can see the date seems correct and has the same format as when I hover on my graph:
-
What did you expect to happen?
I was expecting the annotation to show in my timeseries dashboard at the correct time. -
Did you receive any errors in the Grafana UI or in related logs?
No -
Did you follow any online instructions? If so, what is the URL?
Annotations | Grafana Plugins documentation


Thanks for your help!