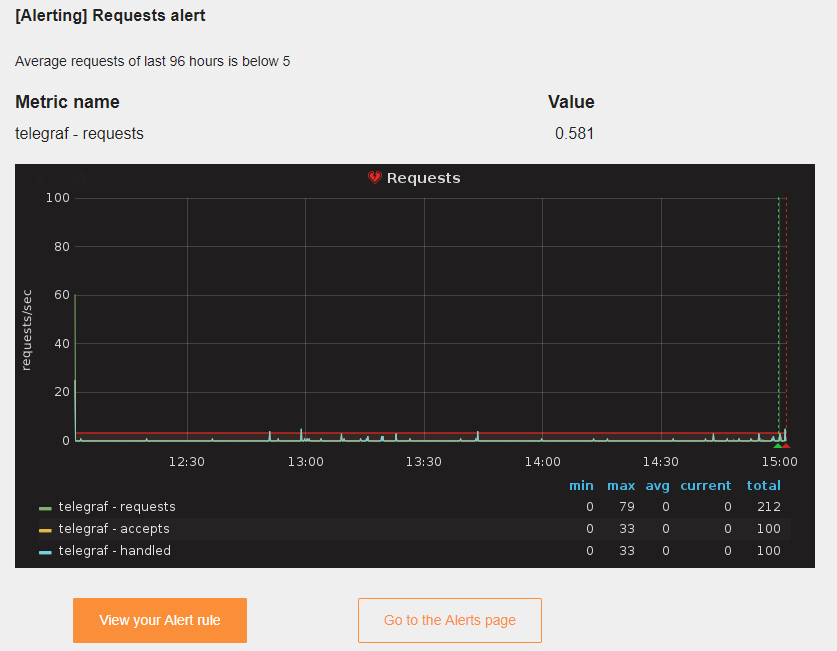
Right now we have more than 30 SIT servers, each of it is running a docker stack and a grafana. If the alert is sending like the normal, please see picture, which SIT is sending this alert?
This is the very basic of alerting system (from where hostname or IP), but grafana seems no easy way to do this?
I need the alert msg title is like this:
Average requests of last 96 hours is below 5 for sit1.domain.com
Hi,
I have exactly the same needs.
Anyone knows how we can customize the title of the alert ?
Thank you for your help
Regards
I think this is this issue: https://github.com/grafana/grafana/issues/6041
It is not implemented yet but will hopefully be done soon (Grafana 5.1).
It looks like this was never added. This will be a problem for me as well. Luckily we will only have 2 (maybe 3) separate Grafana environments so maybe i’ll just use different Slack channels for staging/production.