Is it possible to add error bar to a trend? (or XY chart?)
Like that:
May be Fill below to would fit?
The Fill below to option fills the area between two series. This option is only available as a series/field override.
- Edit the panel and click Overrides.
- Select the fields to fill below.
- In Add override property, select Fill below to.
- Select the series for which you want the fill to stop.
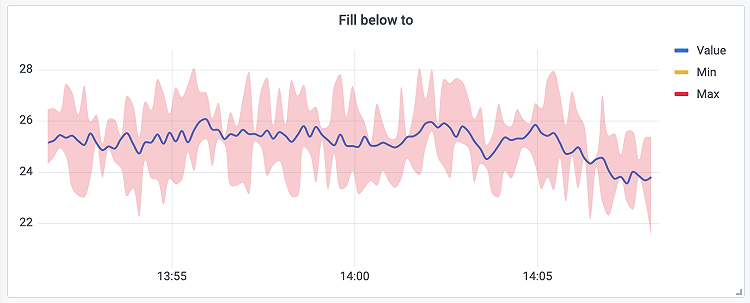
The following example shows three series: Min, Max, and Value. The Min and Max series have Line width set to 0. Max has a Fill below to override set to Min, which fills the area between Max and Min with the Max line color.
Thanks. I’m looking for a more robust solution. meaning applying error bars on multiple trends. meaning without knowing in advanced how many trends will be.
will appreciate any additional help.
@maayangad What is your datasource?
