Hello
8.1 should be able to
The Time Series panel now includes the ability to color lines by threshold values.
is there a example where to set this exactly?
have a nice day
vinc
Hello
8.1 should be able to
The Time Series panel now includes the ability to color lines by threshold values.
is there a example where to set this exactly?
have a nice day
vinc
and on the playground
https://play.grafana.org/d/000000012/grafana-play-home?orgId=1
is 8.1 not added now. ;-(
do i miss something or its just hidden i can’t find it?
There does not appear to be anything on play.grafana.org reflecting v8.1 as of 10-August. Our Grafana Cloud version is also still running v8.0.6 as of 10-August.
You may be better off installing OSS 8.1 and playing around with it.
just would like to find out how to use it
Hello! Did you look at this topic: Graph and color schemes | Grafana Labs?
It has instructions on how to set the color by threshold. Hope this helps.
Hi…
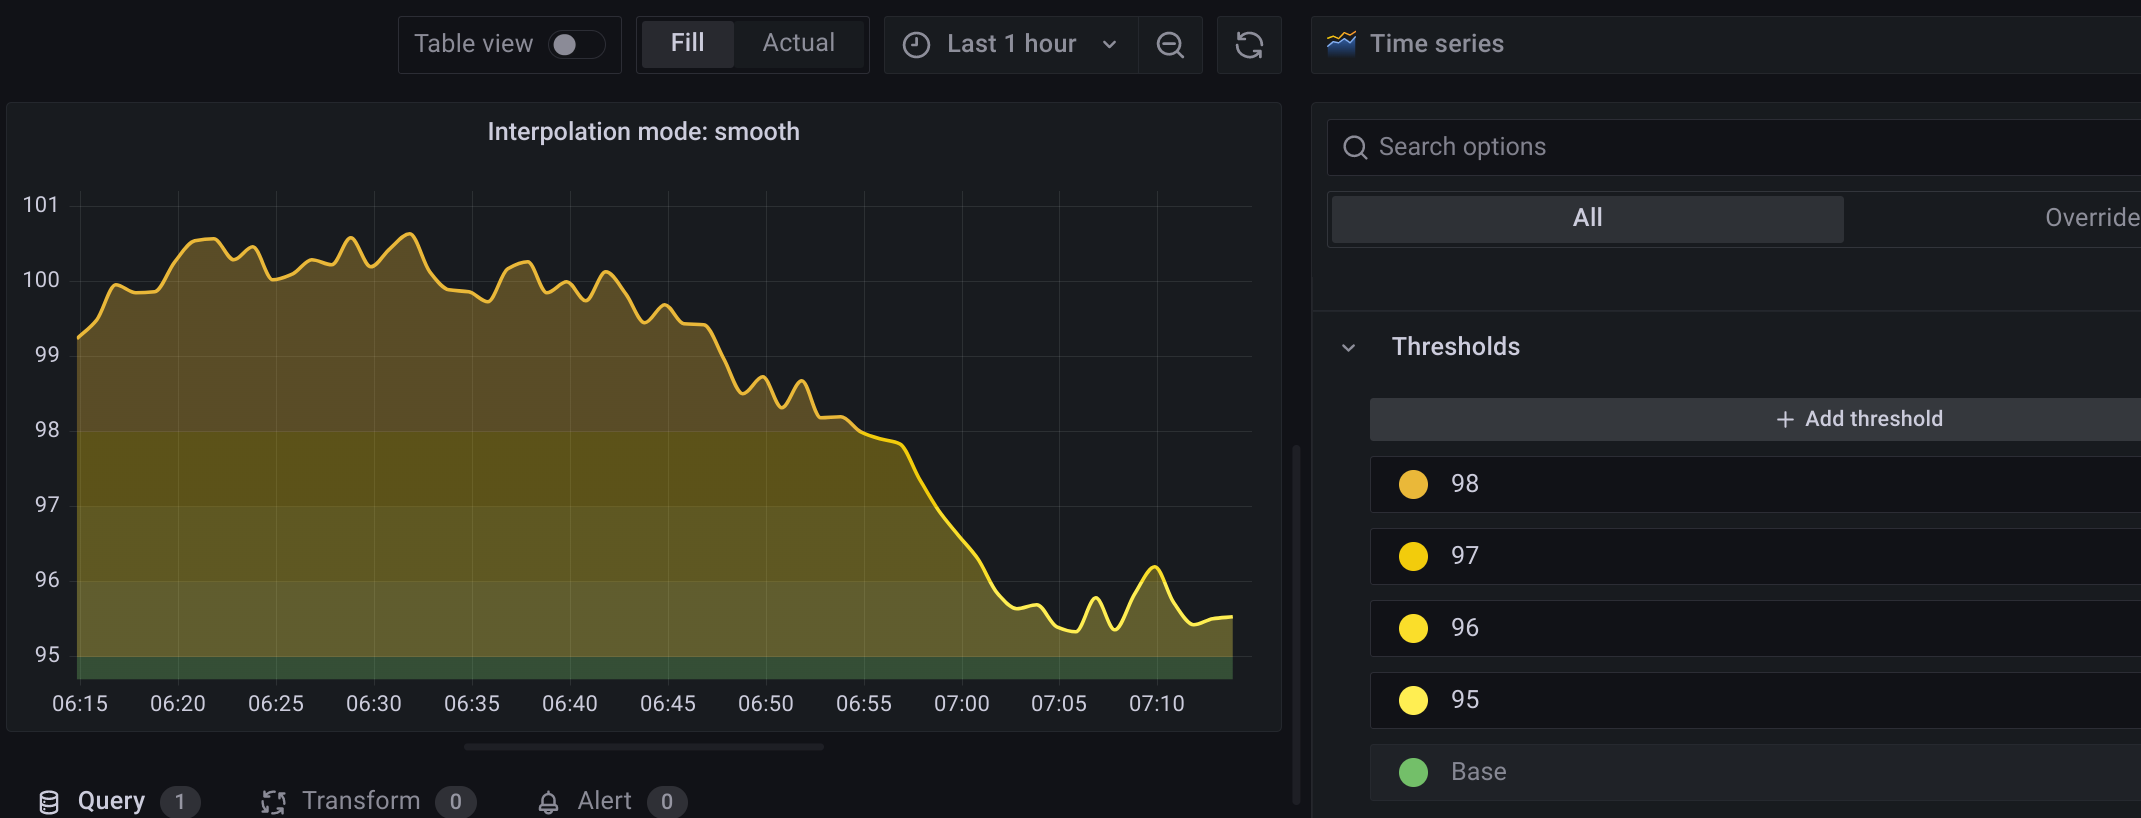
is it possible to have the change of the colors more gradient?
I think you can add more threshold values.
You can choose Custom colors as well, but the default colors may give you what you desire.
would be cool to have the option to set for example 2 values (base and another one) and then apply a gradient to it. It’s not really practical and doesn’t make sense to add thousands of thresholds.
After adding several thresholds i ended up with this:
{
  "datasource": {
    "type": "influxdb",
    "uid": "ce0kvx3h8gsg0a"
  },
  "fieldConfig": {
    "defaults": {
      "custom": {
        "drawStyle": "line",
        "lineInterpolation": "smooth",
        "barAlignment": 1,
        "lineWidth": 1,
        "fillOpacity": 20,
        "gradientMode": "scheme",
        "spanNulls": false,
        "insertNulls": false,
        "showPoints": "auto",
        "pointSize": 4,
        "stacking": {
          "mode": "none",
          "group": "A"
        },
        "axisPlacement": "auto",
        "axisLabel": "",
        "axisColorMode": "text",
        "axisBorderShow": false,
        "scaleDistribution": {
          "type": "linear"
        },
        "axisCenteredZero": false,
        "hideFrom": {
          "tooltip": false,
          "viz": false,
          "legend": false
        },
        "thresholdsStyle": {
          "mode": "off"
        },
        "lineStyle": {
          "fill": "solid"
        }
      },
      "color": {
        "mode": "thresholds",
        "fixedColor": "semi-dark-orange",
        "seriesBy": "last"
      },
      "mappings": [],
      "thresholds": {
        "mode": "absolute",
        "steps": [
          {
            "color": "dark-red",
            "value": null
          },
          {
            "color": "semi-dark-red",
            "value": 1000
          },
          {
            "color": "light-red",
            "value": 2000
          },
          {
            "color": "dark-orange",
            "value": 3000
          },
          {
            "color": "orange",
            "value": 4000
          },
          {
            "color": "super-light-orange",
            "value": 5000
          },
          {
            "color": "semi-dark-yellow",
            "value": 6000
          },
          {
            "color": "light-yellow",
            "value": 7000
          },
          {
            "color": "super-light-green",
            "value": 8000
          },
          {
            "color": "green",
            "value": 9000
          },
          {
            "color": "dark-green",
            "value": 10000
          }
        ]
      },
      "displayName": "Steps",
      "fieldMinMax": false
    },
    "overrides": []
  },
  "gridPos": {
    "h": 8,
    "w": 14,
    "x": 10,
    "y": 11
  },
  "hideTimeOverride": false,
  "id": 68,
  "interval": "1m",
  "options": {
    "tooltip": {
      "mode": "multi",
      "sort": "none",
      "maxHeight": 600
    },
    "legend": {
      "showLegend": false,
      "displayMode": "list",
      "placement": "bottom",
      "calcs": [
        "mean",
        "max",
        "min"
      ]
    }
  },
  "pluginVersion": "11.0.1",
  "targets": [
    {
      "datasource": {
        "type": "influxdb",
        "uid": "ce0kvx3h8gsg0a"
      },
      "groupBy": [
        {
          "params": [
            "$__interval"
          ],
          "type": "time"
        },
        {
          "params": [
            "null"
          ],
          "type": "fill"
        }
      ],
      "hide": false,
      "measurement": "Steps_Intraday",
      "orderByTime": "ASC",
      "policy": "default",
      "refId": "B",
      "resultFormat": "time_series",
      "select": [
        [
          {
            "params": [
              "value"
            ],
            "type": "field"
          },
          {
            "params": [],
            "type": "sum"
          },
          {
            "params": [],
            "type": "cumulative_sum"
          }
        ]
      ],
      "tags": []
    },
    {
      "alias": "Steps",
      "datasource": {
        "type": "influxdb",
        "uid": "ce0kvx3h8gsg0a"
      },
      "groupBy": [
        {
          "params": [
            "$__interval"
          ],
          "type": "time"
        },
        {
          "params": [
            "null"
          ],
          "type": "fill"
        }
      ],
      "hide": true,
      "measurement": "heartrate",
      "orderByTime": "ASC",
      "policy": "default",
      "query": "from(bucket: \"${bucket}\")\n  |> range(start: v.timeRangeStart, stop: v.timeRangeStop)\n  |> filter(fn: (r) => r[\"_measurement\"] == \"Steps_Intraday\")\n  |> filter(fn: (r) => r[\"_field\"] == \"value\")\n  |> aggregateWindow(every: v.windowPeriod, fn: mean, createEmpty: false)\n  |> movingAverage(n: 6)\n  |> yield(name: \"mean\")",
      "queryType": "randomWalk",
      "rawQuery": true,
      "refId": "A",
      "resultFormat": "time_series",
      "select": [
        [
          {
            "params": [
              "value"
            ],
            "type": "field"
          },
          {
            "params": [],
            "type": "mean"
          },
          {
            "params": [
              "6"
            ],
            "type": "moving_average"
          }
        ]
      ],
      "tags": []
    }
  ],
  "title": "Daily Steps",
  "transparent": true,
  "type": "timeseries"
}
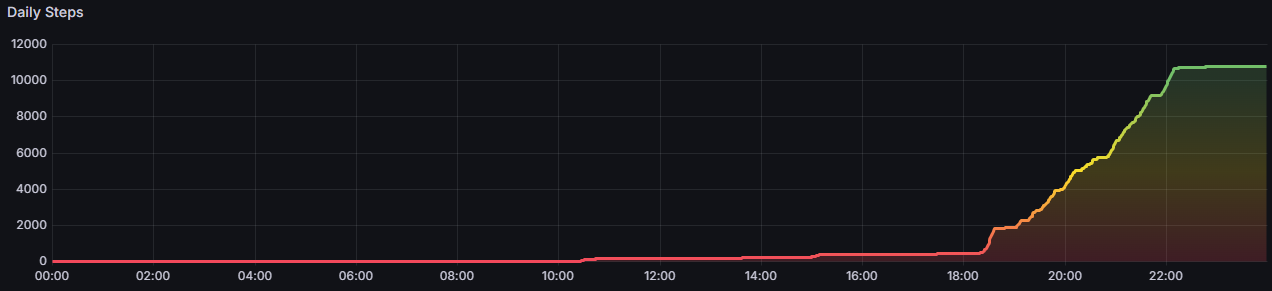
I didn’t like it, so i played around a bit more and found, that using a soft max of 10000 in combination with the color scheme “Red-yellow-green (by value)” does exactly what i wanted.
This makes sense for me as im measuring my steps here and 10000 is my daily goal. Therefore this might not be a universal solution, but its probably way better than using many thresholds to get a “kind of gradient”.
This is the final result:
{
“datasource”: {
“type”: “influxdb”,
“uid”: “ce0kvx3h8gsg0a”
},
“fieldConfig”: {
“defaults”: {
“custom”: {
“drawStyle”: “line”,
“lineInterpolation”: “smooth”,
“barAlignment”: 0,
“lineWidth”: 3,
“fillOpacity”: 20,
“gradientMode”: “scheme”,
“spanNulls”: false,
“insertNulls”: false,
“showPoints”: “auto”,
“pointSize”: 5,
“stacking”: {
“mode”: “none”,
“group”: “A”
},
“axisPlacement”: “auto”,
“axisLabel”: “”,
“axisColorMode”: “text”,
“axisBorderShow”: false,
“scaleDistribution”: {
“type”: “linear”
},
“axisCenteredZero”: false,
“hideFrom”: {
“tooltip”: false,
“viz”: false,
“legend”: false
},
“thresholdsStyle”: {
“mode”: “off”
},
“axisSoftMax”: 10000
},
“color”: {
“mode”: “continuous-RdYlGr”
},
“mappings”: ,
“thresholds”: {
“mode”: “absolute”,
“steps”: [
{
“color”: “green”,
“value”: null
}
]
},
“fieldMinMax”: false
},
“overrides”:
},
“gridPos”: {
“h”: 8,
“w”: 14,
“x”: 10,
“y”: 11
},
“hideTimeOverride”: false,
“id”: 68,
“interval”: “1m”,
“options”: {
“tooltip”: {
“mode”: “single”,
“sort”: “none”,
“maxHeight”: 600
},
“legend”: {
“showLegend”: false,
“displayMode”: “hidden”,
“placement”: “right”,
“calcs”:
}
},
“pluginVersion”: “11.0.1”,
“targets”: [
{
“datasource”: {
“type”: “influxdb”,
“uid”: “ce0kvx3h8gsg0a”
},
“groupBy”: [
{
“params”: [
“$__interval”
],
“type”: “time”
},
{
“params”: [
“null”
],
“type”: “fill”
}
],
“hide”: false,
“measurement”: “Steps_Intraday”,
“orderByTime”: “ASC”,
“policy”: “default”,
“refId”: “B”,
“resultFormat”: “time_series”,
“select”: [
[
{
“params”: [
“value”
],
“type”: “field”
},
{
“params”: ,
“type”: “sum”
},
{
“params”: ,
“type”: “cumulative_sum”
}
]
],
“tags”:
},
{
“alias”: “Steps”,
“datasource”: {
“type”: “influxdb”,
“uid”: “ce0kvx3h8gsg0a”
},
“groupBy”: [
{
“params”: [
“$__interval”
],
“type”: “time”
},
{
“params”: [
“null”
],
“type”: “fill”
}
],
“hide”: true,
“measurement”: “heartrate”,
“orderByTime”: “ASC”,
“policy”: “default”,
“query”: “from(bucket: "${bucket}")\n |> range(start: v.timeRangeStart, stop: v.timeRangeStop)\n |> filter(fn: (r) => r["_measurement"] == "Steps_Intraday")\n |> filter(fn: (r) => r["_field"] == "value")\n |> aggregateWindow(every: v.windowPeriod, fn: mean, createEmpty: false)\n |> movingAverage(n: 6)\n |> yield(name: "mean")”,
“queryType”: “randomWalk”,
“rawQuery”: true,
“refId”: “A”,
“resultFormat”: “time_series”,
“select”: [
[
{
“params”: [
“value”
],
“type”: “field”
},
{
“params”: ,
“type”: “mean”
},
{
“params”: [
“6”
],
“type”: “moving_average”
}
]
],
“tags”:
}
],
“title”: “Daily Steps”,
“transparent”: true,
“type”: “timeseries”
}