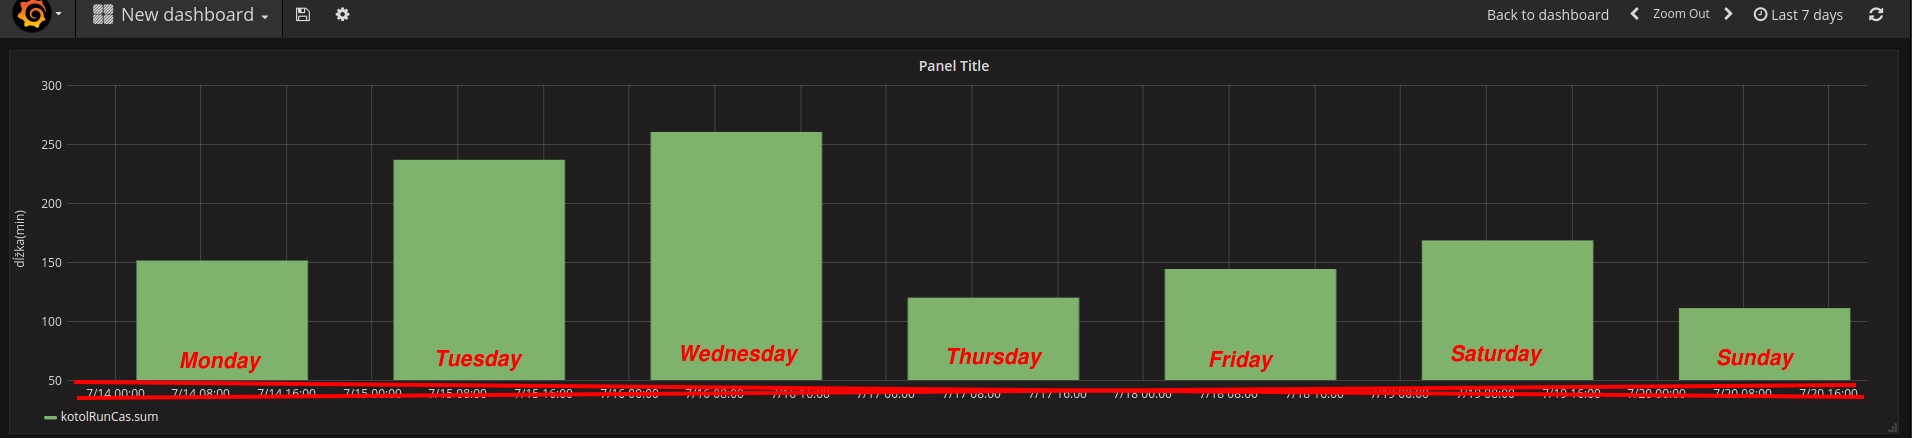
Help me with Grafana chart with X-Axis. I want summarize by Day,last 7 days. I would like Monday,Tuesday etc or only day 10.7.2014, 11.7.2017 and etc
I don’t know how to change X-Axis

There are two parts to this:
- Choose the last 7 days in the time range picker (I presume that you found that already). Or do you mean the “week so far” rather than exactly the last 7 days?
- Group by day in the query - you do not say which data source you are using. Here are some examples:
- Graphite:
summarize(1h, avg) - InfluxDB: Use the Group by time interval field:

Im using Influxdb. The same result like above.
@kiko79 Don’t know what you are asking. More detail please.

Hi, did you find the solution of how to change the x-axis to show days of the week only?