Hi. I use Node Exporter Full dashboard. Quick CPU information is ok but Basic CPU information is not showed data. Please advise


Hi @fintechblognet,
Welcome to the ![]() community support forums !!
community support forums !!
Can you please share the link of the Dashboard you downloaded so that I can also check it and try to reproduce it?
Hi. I used “Node Exporter Full” dashboard.
Link: Node Exporter Full | Grafana Labs

Hi @fintechblognet,
Thanks for sharing the link.
I have tested it out on my test machine and it seems to be working fine.

The things I did was:
Once I imported this dashboard, the Basic CPU information was also blank like yours and I went to that panel by selecting “Edit” and there I see the following PromQL queries;

(which seems different in your shared screenshot)
However, once I go back without making any changes and set the time range (in the top right corner) from 24hrs to 5 min. The graph got populated.
I am using Grafana ver 9
I am not sure why it shows “Random walk” in the query field even though “Prometheus” is set as a datasource in your screenshot. One tip would be to change the UID of the imported dashboard from default to something random.
If that still does not help then open a GitHub issue to the developer directly as this Dashboard is not maintained by us directly but by a community user.
Here is the link to that.
I hope this helps.
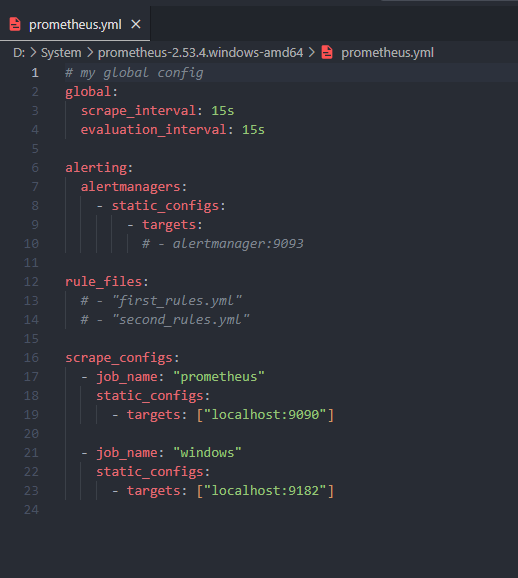
I know this is an old problem, but if someone, like me, ends up here looking for a solution to a similar issue, please check the scrape_interval setting for the scrape job and whether it matches what is set by default in Grafana for the Prometheus data source (which is typically 15s).
If the job has a longer interval set, the symptom will be missing data for charts with a relatively small time window (eg. less than a day). For a larger time window (e.g., 2 days), the data should be visible.
Solution: change your scrape job interval to match what is set in Grafana.