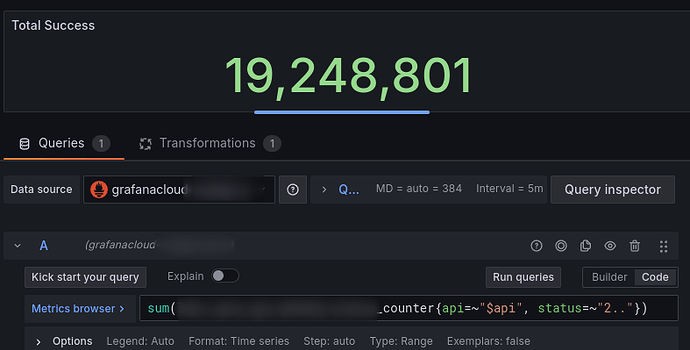
We are using Grafana Cloud.
We have a simple stat visualization which shows total traffic values.
The data is gather from a SUM from one of our counter recording rules.
The recording rule is a Count over time metric from Loki Logs.
The issue we are seeing is that the totals are not calculating correctly for some time ranges, specifically between 28 to 35 hours.
See counts:
What are we missing here?
Hi, I’d guess it’s the interval of the query. You can check that by changing the time range and observing the interval to the left of datasource picker (or you can change to time series for a moment and see how far apart in time are points displayed). I also guess your calculation on stat panel is Total?
(If you reply, please tag me in your response, as I don’t see notifications otherwise, I don’t know why  )
)
1 Like
What is the transformation being used?
What is your datetime format?
Thanks @dawiddebowski
You were correct about the query interval. Because this value get auto-generated by Grafana I saw the interval shifting from the recording rune interval (1m) to 2m and 5m depending on the time frame.
The solution was to increase the Max Data Points to a large number and that keeps the interval to 1m. Not elegant, but it works.
I think you could use sum over time from PromQl like sum_over_time(<original query>[$__range:1m]) and set it to be an instant query - that way no matter the Grafana-calculated interval, you’d have just one value that would be in your interval (1m after semicolon)
1 Like


