Hi,
I want to visualise a sensor which has two values, On and Off e.g 0 = Off and 1 = On. I want to see this sensor value in time.
Something like this :
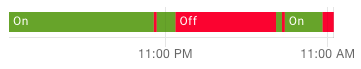
or like this :

And at the same time to be able to use a cursor to see values. As you can see the simple example is tha the sensor has one state but could also have multiple states.
Question
Can this be achieved with Grafana and if yes how ?
/donnib