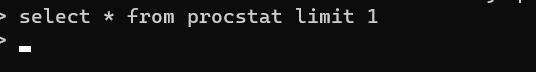
I am trying to view the top command in Linux. I saw a dashboard to top, but the measurements doesn’t have anything it’s describing. How can I display the top command via telegraf and influx?
What does this top command mean?
I had to Google it. top command in Linux with Examples - GeeksforGeeks
1 Like
I was trying to get this to work but the measurements it queries for isn’t there:
1 Like
how were you trying to get it to work? What did you do?
I looked at the query included with the dashboard, but none of the records for the measurement queried had the columns in it
Dashboard Query:
SELECT host, pid, memory_vms, memory_rss, memory_swap, cpu_usage, cpu_time_user, process_name FROM “procstat” WHERE “host” =~ /$server$/ AND $timeFilter
do you have such a table procstat in one of your databases?
No it’s under telegraf. There are no procstat measurements. There’s procstat under the telegraf config
So you have configureeld telegraf and it is running successfully and pushing data to your database such as influxdb?
Please show us what you have done si far? Hard to understand what you have done and what is not working
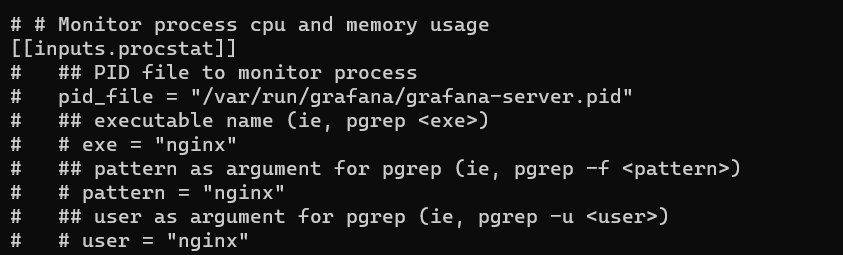
I uncommented the procstat input and restarted telegraf. However I don’t see the procstat measurement, only procstat_lookup. So the dashboard query can’t work
Still not clear as you didnt answer my previous questions. This might help
I did what the requirements of the dash board are yet nothing. So that’s where I’m at
1 Like
still waiting for you to answer these questions.
Have you configured telegraf and it is running successfully and pushing data to your database such as influxdb?
Please show us what you have done so far in your telegraf config?
1 Like
Yes I’m pushing to the InfluxDB just fine. However, when I enable the inputs.procstat:
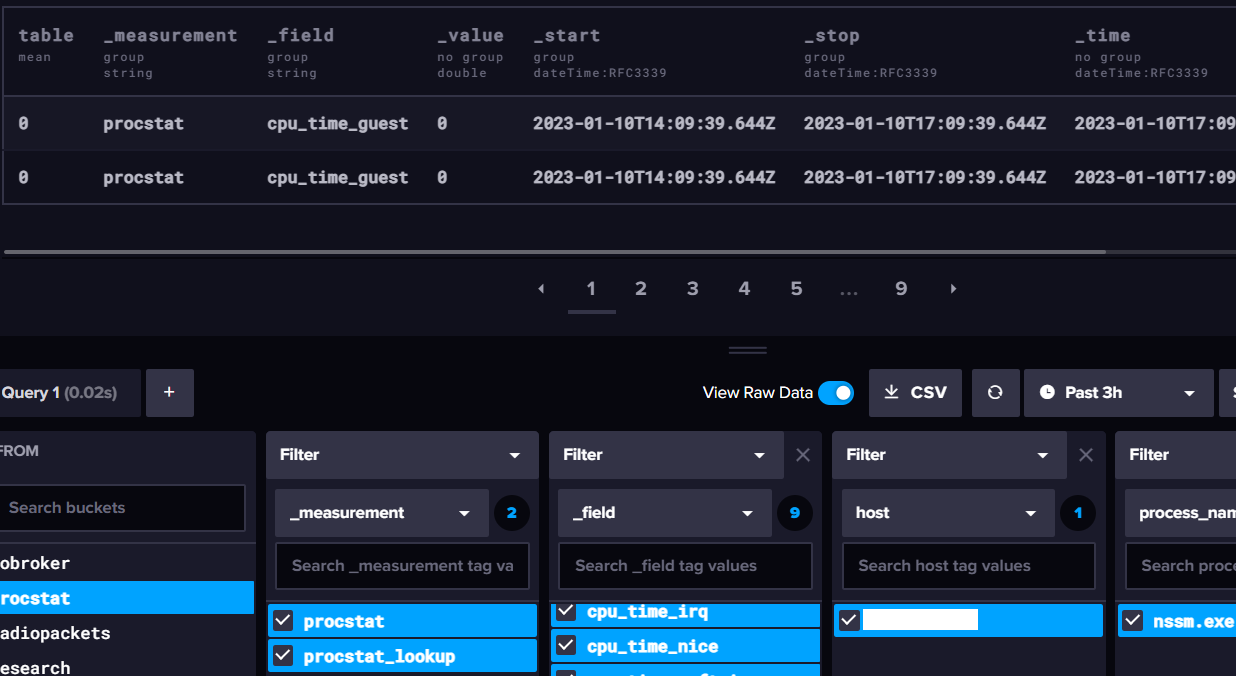
It only creates this measurement:

It doesn’t create the correct measurement and it doesn’t have the values its polling for:

1 Like
you have enabled it but you have not told it what to read or what to run.
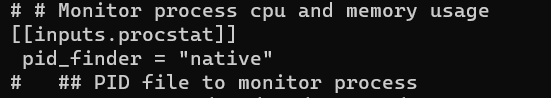
In my case I just let it use native pid_finder.
  ## Method to use when finding process IDs.  Can be one of 'pgrep', or
  ## 'native'.  The pgrep finder calls the pgrep executable in the PATH while
  ## the native finder performs the search directly in a manor dependent on the
  ## platform.  Default is 'pgrep'
  pid_finder = "native"
Might want to look up the docu
Still no procstat measurement:

notice I said “In my case” purposely. Dont just copy/pasta, figure it out for your operating system
Doesn’t matter what I use. Same issue.
All I want to do is to be able to display top in Grafana. Is there a way?
it depends. what host are you trying to scrape data from? and what OS does it have?