I know a lot of questions are put here in how to use Grafana for system administration so I will give an example where using two dashboards to troubleshoot a CPU resource issue
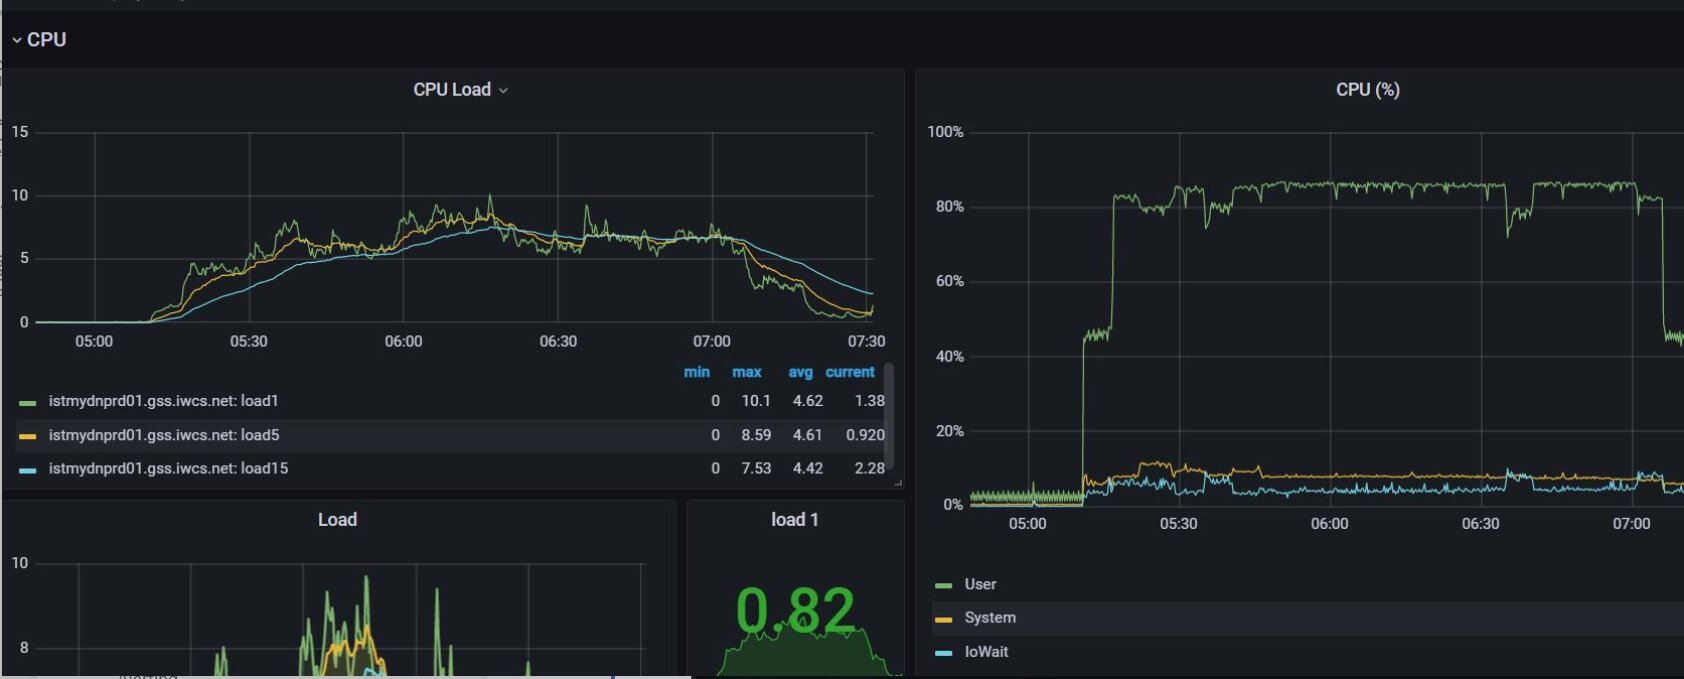
I was informed of a peak in CPU usage on a server and asked to investigate. Looking at the Linux dashboard I pinpointed the time and dragged in for a deeper look:

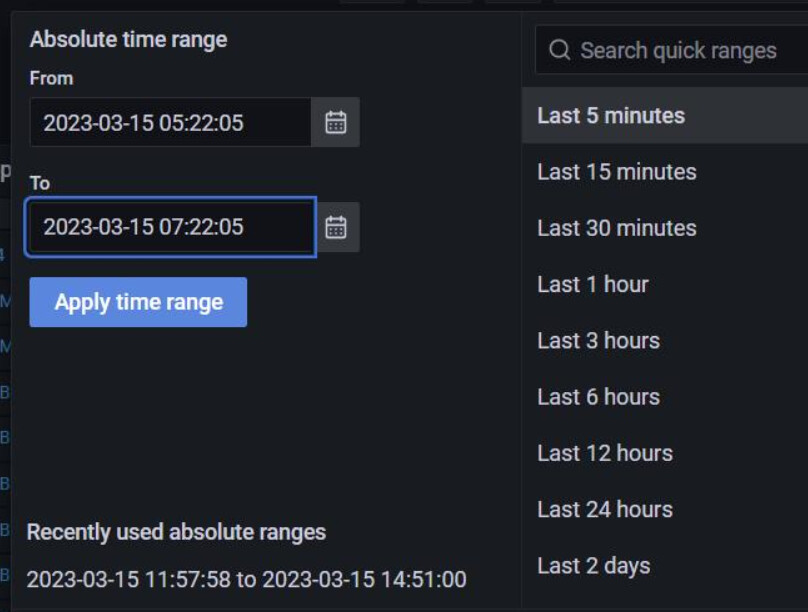
After finding the time of the event I then copied the time range and moved on to the Process Top dashboard. I then applied the time range copied from the Linux dashboard:
I clicked on the CPU usage to order by biggest user:
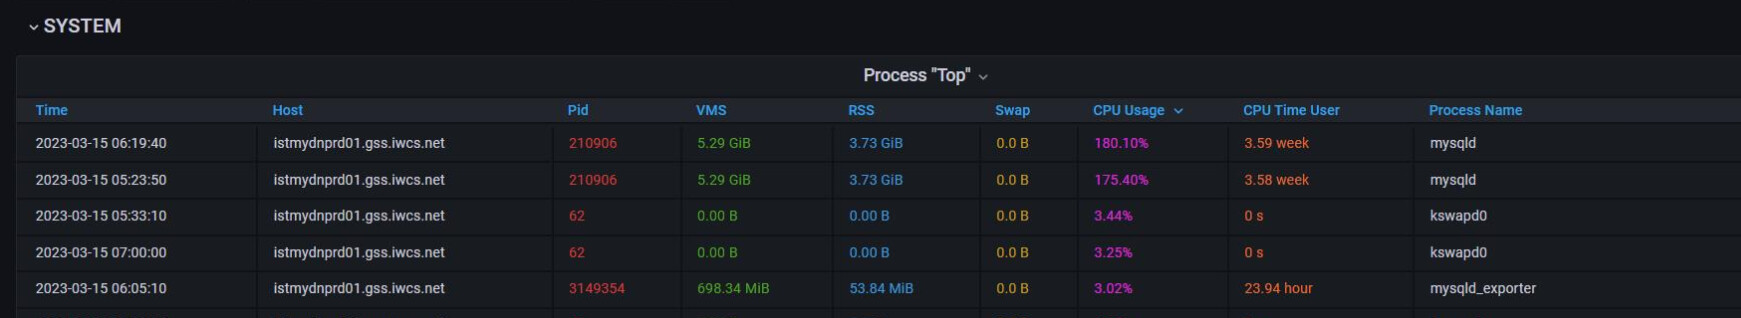
As we can see, mysqld was the CPU hog. With this in mind now, I investigated MySQL for any issues that were going on with the server.
For those wanting to use the Process Top dashboard it is 3387. This uses InfluxDB/Telegraf. In your Telegraph configuration make sure it is set the [[inputs.procstat]] with the one line:
pattern = “.*”
I hope this helps out someone that might be looking for a needle in a haystack.